The goal of the project is to highlight the importance of visualization to derive powerful insights, smarter missing values imputation and feature engineering using simple plots in R. The basic plotting and ggplot commands in R is used for multiple variable analysis.
The goal of the data set is to predict the sales of supermarkets given information such as location, type and the kind of products sold at outlets of the supermarkets. Further, product information such as item visibility in the supermarket, the fat content and MRP are other important features given in the data set.
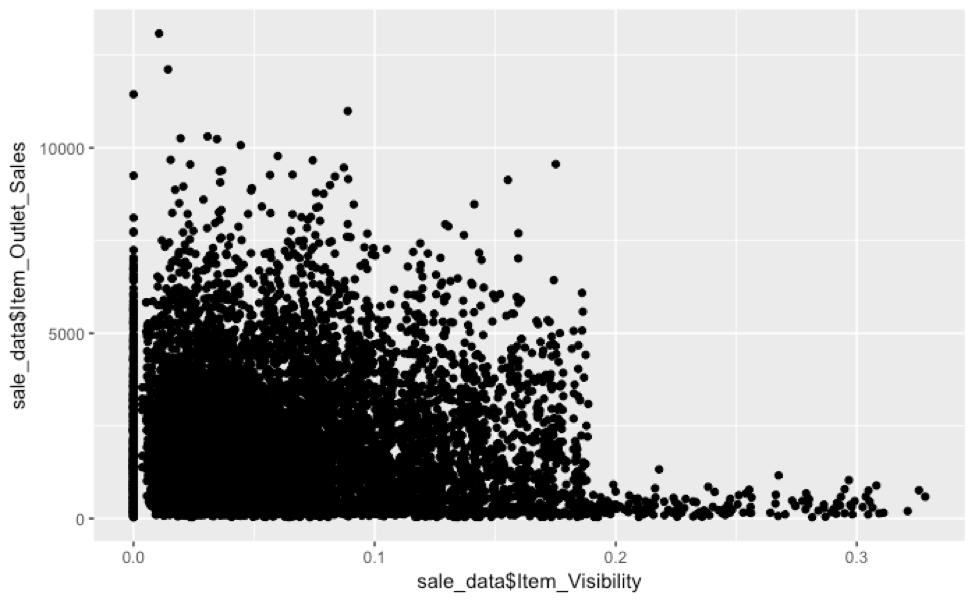
The target variable (Item_Outlet_Sales) is plotted against various attributes to understand dependencies/prediction power of the attributes.
From the plots (using the attached code), important plots have been uploaded and the insight/learning from each plot is documented in a separate file.
