Audio spectrum display on a TFT
This sketch is for the RP2040 Arduino Nano Connect connected to a 320 x 240 TFT display. It uses the onboard microphone to sample audio signals and display the frequency spectra on a TFT display. The sketch uses FFT analysis to extract the frequency spectrum from the signal.
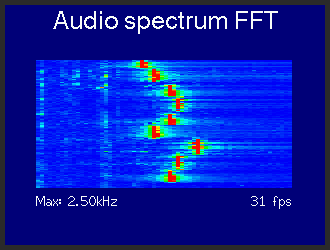
The spectrum can be displayed as a spectrum (frequency .v. amlitude) format, or as a scrolling waterfall (frequency .v. time).
The peaks are displayed and decay. The waveform can also be displayed.
Screen update rate varies with the number of FFT samples taken, example fps performance with 62.5MHz SPI clock:
- FFT samples = 64 -> 100 fps
- FFT samples = 128 -> 78 fps
- FFT samples = 256 -> 31 fps
- FFT samples = 512 -> 15 fps
The sketch requires the Earle Philhower RP2040 board package (includes PDM microphone library) to be used: https://github.com/earlephilhower/arduino-pico
The TFT_eSPI library is also used, available using the Arduino IDE library manager or here: https://github.com/Bodmer/TFT_eSPI
Screen shots: