[Bug] matplotlib changes the scale of the window
Thithic opened this issue · comments

Type of Issue (Enhancement, Error, Bug, Question)
Bug
Operating System
Windows 10
PySimpleGUI Port (tkinter, Qt, Wx, Web)
Tkinter
Versions
Version information can be obtained by calling sg.main_get_debug_data()
Or you can print each version shown in ()
Python version (sg.sys.version)
3.9.12
PySimpleGUI Version (sg.__version__)
4.59.0
GUI Version (tkinter (sg.tclversion_detailed), PySide2, WxPython, Remi)
Tkinter version 8.6.12
Your Experience In Months or Years (optional)
3 Years Python programming experience
6 Years Programming experience overall
Have used another Python GUI Framework? (tkinter, Qt, etc) (yes/no is fine) : no
Anything else you think would be helpful?
Troubleshooting
These items may solve your problem. Please check those you've done by changing - [ ] to - [X]
- Searched main docs for your problem www.PySimpleGUI.org
- Looked for Demo Programs that are similar to your goal Demos.PySimpleGUI.org
- If not tkinter - looked for Demo Programs for specific port
- For non tkinter - Looked at readme for your specific port if not PySimpleGUI (Qt, WX, Remi)
- Run your program outside of your debugger (from a command line)
- Searched through Issues (open and closed) to see if already reported Issues.PySimpleGUI.org
- Tried using the PySimpleGUI.py file on GitHub. Your problem may have already been fixed but not released
Detailed Description
Hello,
I have a main window with a button that opens a new window with matplotlib graph inside.
In the code below, the button simply triggers the line plt.figure(). As soon as the button is pressed, the scale of the main window seems to change.
The same goes with the Demo program "Demo_Matplotlib_Two_Windows"
Did I miss something or is it a bug ?
Thank you
Code To Duplicate
A short program that isolates and demonstrates the problem (Do not paste your massive program, but instead 10-20 lines that clearly show the problem)
This pre-formatted code block is all set for you to paste in your bit of code:
import PySimpleGUI as sg
import matplotlib.pyplot as plt

w = sg.Window(
    title="title",
    layout=
        [
            [sg.Text("hello there")],
            [sg.Button("add window", key="-add-")],
            [sg.Button("quit", key="-quit-")]
        ]
    )

while True:
    event, _ = w.read()
    if event in [sg.WIN_CLOSED, "-quit-"]:
        break
    elif event == "-add-":
        plt.figure()

w.close()
Screenshot, Sketch, or Drawing

Watcha Makin?
If you care to share something about your project, it would be awesome to hear what you're building.

It's a known issue as in
My suggestion is
Don't use matplotlib.pyplot.figure for matplotlib 3.5.1, but matplotlib.figure.Figure to generate your figure.
# fig = plt.figure(figsize=(1, 1), dpi=130)
fig = Figure(figsize=(5, 4), dpi=100)
Two example codes here
import math, random
from pathlib import Path

from matplotlib.backends.backend_tkagg import FigureCanvasTkAgg
from matplotlib.figure import Figure
import PySimpleGUI as sg

# 1. Define the class as the interface between matplotlib and PySimpleGUI
class Canvas(FigureCanvasTkAgg):
    """
    Create a canvas for matplotlib pyplot under tkinter/PySimpleGUI canvas
    """
    def __init__(self, figure=None, master=None):
        super().__init__(figure=figure, master=master)
        self.canvas = self.get_tk_widget()
        self.canvas.pack(side='top', fill='both', expand=1)

# 2. create PySimpleGUI window, a fixed-size Frame with Canvas which expand in both x and y.
font = ("Courier New", 11)
sg.theme("DarkBlue3")
sg.set_options(font=font)
layout = [
    [sg.Input(expand_x=True, key='Path'),
     sg.FileBrowse(file_types=(("ALL CSV Files", "*.csv"), ("ALL Files", "*.*"))),
     sg.Button('Plot')],
    [sg.Frame("", [[sg.Canvas(background_color='green', expand_x=True, expand_y=True, key='Canvas')]], size=(640, 480))],
    [sg.Push(), sg.Button('Exit')]
]
window = sg.Window('Matplotlib', layout, finalize=True)

# 3. Create a matplotlib canvas under sg.Canvas or sg.Graph
fig = Figure(figsize=(5, 4), dpi=100)
ax = fig.add_subplot()
canvas = Canvas(fig, window['Canvas'].Widget)

# 4. initial for figure
ax.set_title(f"Sensor Data")
ax.set_xlabel("X axis")
ax.set_ylabel("Y axis")
ax.set_xlim(0, 1079)
ax.set_ylim(-1.1, 1.1)
ax.grid()
canvas.draw()                       # do Update to GUI canvas

# 5. PySimpleGUI event loop
while True:
    event, values = window.read()
    if event in (sg.WINDOW_CLOSED, 'Exit'):
        break
    elif event == 'Plot':
        """
        path = values['Path']
        if not Path(path).is_file():
            continue
        """
        # 6. Get data from path and plot from here
        ax.cla()                    # Clear axes first if required
        ax.set_title(f"Sensor Data")
        ax.set_xlabel("X axis")
        ax.set_ylabel("Y axis")
        ax.grid()
        theta = random.randint(0, 359)
        x = [degree for degree in range(1080)]
        y = [math.sin((degree+theta)/180*math.pi) for degree in range(1080)]
        ax.plot(x, y)
        canvas.draw()               # do Update to GUI canvas

# 7. Close window to exit
window.close()
import PySimpleGUI as sg
from matplotlib.backends.backend_tkagg import FigureCanvasTkAgg
from matplotlib.figure import Figure
import numpy as np

def generate_plot_example(title = 'Plot Title', xaxis= 'X-Axis Values', yaxis='Y-Axis Values'):
    values_to_plot = (20, 35, 30, 35, 27)
    ind = np.arange(len(values_to_plot))
    width = 0.4
    # fig = plt.figure(figsize=(5, 4), dpi=100)
    fig = Figure(figsize=(5, 4), dpi=100)
    fig.patch.set_facecolor('#E7F5F9')
    ax = fig.add_subplot(1,1,1)
    ax.bar(ind, values_to_plot, width)
    return fig

figure = generate_plot_example()

size = (640, 480)
canvas = sg.Canvas(key='canvas', expand_x=True,expand_y=True)
plot_layout = [[sg.Frame("Frame",[[canvas]], size=size)]]
window = sg.Window('PySimpleGUIScaleIssue', plot_layout, finalize=True, size=size)

figure_canvas_agg = FigureCanvasTkAgg(figure, window['canvas'].TKCanvas)
figure_canvas_agg.get_tk_widget().pack(side='bottom', fill='both', expand=1)
figure_canvas_agg.draw()

window.read(close=True)

@jason990420 - Should I update all the Matplotlib Demo Programs??
It should be better if all matplotlib demos updated and confirmed.
Ok thank you for your answer, I stumbled upon those issues but didn't made a link.
Your answer indeed fixes the problem, thank you
I want to keep this open until I can get these demo programs changed.
I'm looking at the matplotlib demos now.
@jason990420 , these changes.... does it mean I can no longer use the matplotlib.plt calls that are all over the place?
Like this very basic example
def PyplotSimple():
    import numpy as np
    import matplotlib.pyplot as plt

    # evenly sampled time .2 intervals
    t = np.arange(0., 5., 0.2)          # go from 0 to 5 using .2 intervals

    # red dashes, blue squares and green triangles
    plt.plot(t, t, 'r--', t, t ** 2, 'bs', t, t ** 3, 'g^')

    fig = plt.gcf()  # get the figure to show
    return fig
Do I need to change all these?
does it mean I can no longer use the matplotlib.plt calls that are all over the place?
You cannot use the matplotlib.plt calls.
Method matplotlib.pyplot.gcf() will get active figure returned if it exist, else return matplotlib.pyplot.figure().
On 3.6, I wasn't able to install 3.5.2. I needed to use my 3.9 distro. Want to make sure that I continue to support both versions.. 3.4.2 and 3.5.2 since it's not possible for some people to upgrade.
I'm not doing very well at this.
Can you help change one of these functions so that I can maybe learn enough, see the pattern, and I do the rest of them? I'm sorry that I've not been very involved with the matplotlib stuff... you've done such an amazing job of supporting everyone thatI've been able to not try to keep up.
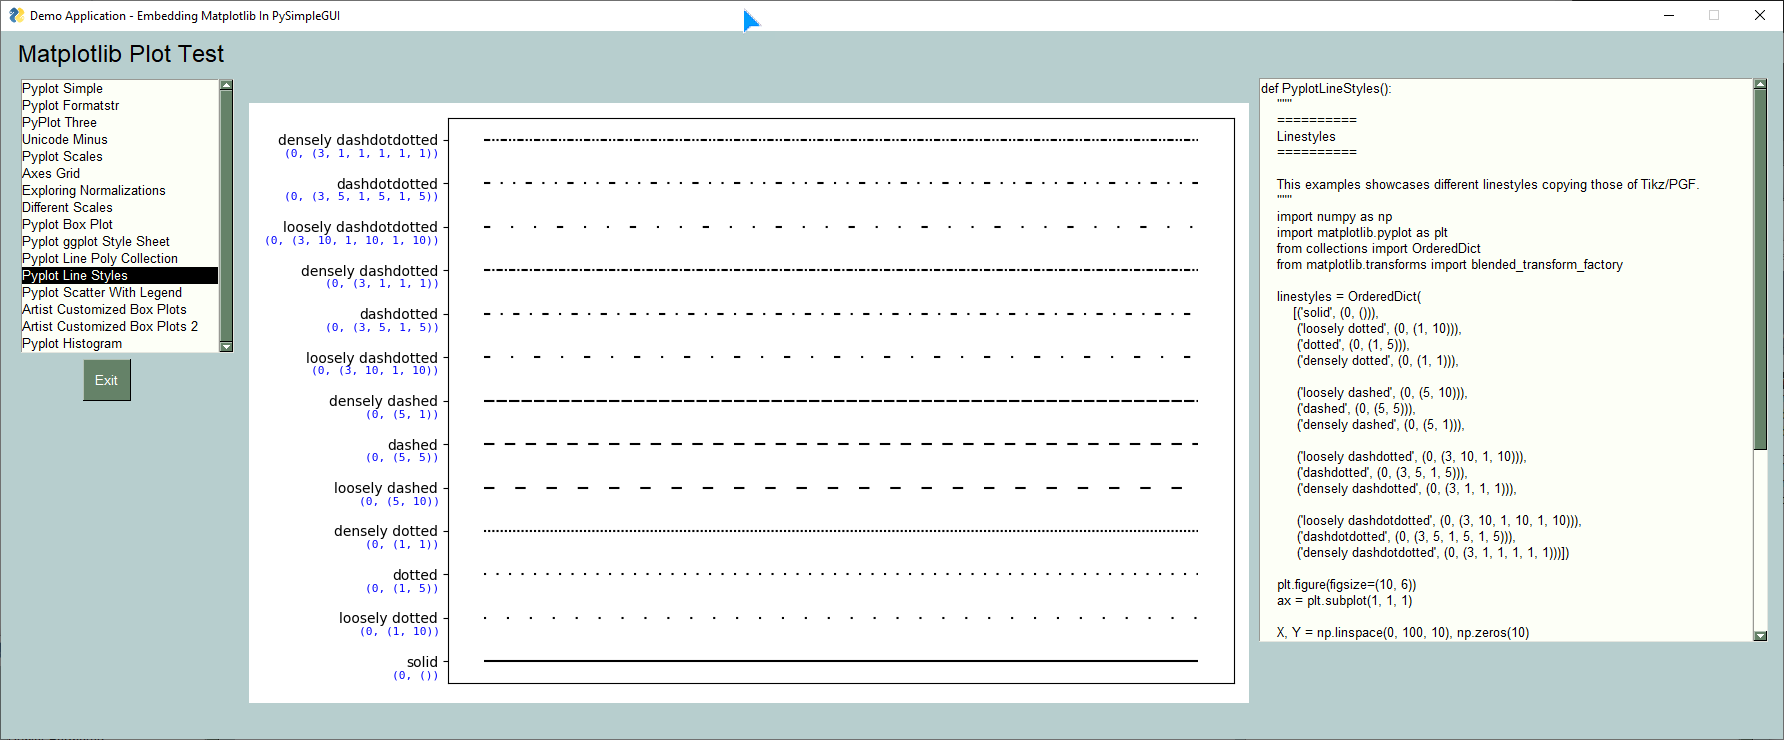
def PyplotLineStyles():
    """
    ==========
    Linestyles
    ==========

    This examples showcases different linestyles copying those of Tikz/PGF.
    """
    import numpy as np
    import matplotlib.pyplot as plt
    from collections import OrderedDict
    from matplotlib.transforms import blended_transform_factory

    linestyles = OrderedDict(
        [('solid', (0, ())),
         ('loosely dotted', (0, (1, 10))),
         ('dotted', (0, (1, 5))),
         ('densely dotted', (0, (1, 1))),

         ('loosely dashed', (0, (5, 10))),
         ('dashed', (0, (5, 5))),
         ('densely dashed', (0, (5, 1))),

         ('loosely dashdotted', (0, (3, 10, 1, 10))),
         ('dashdotted', (0, (3, 5, 1, 5))),
         ('densely dashdotted', (0, (3, 1, 1, 1))),

         ('loosely dashdotdotted', (0, (3, 10, 1, 10, 1, 10))),
         ('dashdotdotted', (0, (3, 5, 1, 5, 1, 5))),
         ('densely dashdotdotted', (0, (3, 1, 1, 1, 1, 1)))])

    plt.figure(figsize=(10, 6))
    ax = plt.subplot(1, 1, 1)

    X, Y = np.linspace(0, 100, 10), np.zeros(10)
    for i, (name, linestyle) in enumerate(linestyles.items()):
        ax.plot(X, Y + i, linestyle=linestyle, linewidth=1.5, color='black')

    ax.set_ylim(-0.5, len(linestyles) - 0.5)
    plt.yticks(np.arange(len(linestyles)), linestyles.keys())
    plt.xticks([])

    # For each line style, add a text annotation with a small offset from
    # the reference point (0 in Axes coords, y tick value in Data coords).
    reference_transform = blended_transform_factory(ax.transAxes, ax.transData)
    for i, (name, linestyle) in enumerate(linestyles.items()):
        ax.annotate(str(linestyle), xy=(0.0, i), xycoords=reference_transform,
                    xytext=(-6, -12), textcoords='offset points', color="blue",
                    fontsize=8, ha="right", family="monospace")

    plt.tight_layout()
    return plt.gcf()
There are 9 demos that use plt.figure and I'm assuming they all have to change.
This function is from the Demo_Matplotlib_Browser.py
It's the one that makes this figure:
I've not been very involved with the matplotlib stuff
Me too.
Like what I said some time, "I know nothing about it", all I did is to find the answer, work around or solution for issues here.
I found it work different by accident, and it could be a work around here, but don't know why.
Don't use
matplotlib.pyplot.figureformatplotlib 3.5.1, butmatplotlib.figure.Figureto generate your figure.
Just revise all calls to matplotlib.pyplot to matplotlib.Figure or it's AxesSubplot.
from collections import OrderedDict

import numpy as np
from matplotlib.figure import Figure
from matplotlib.transforms import blended_transform_factory
from matplotlib.backends.backend_tkagg import FigureCanvasTkAgg
import PySimpleGUI as sg

class Canvas(FigureCanvasTkAgg):
    """
    Create a canvas for matplotlib pyplot under tkinter/PySimpleGUI canvas
    """
    def __init__(self, figure=None, master=None):
        super().__init__(figure=figure, master=master)
        self.canvas = self.get_tk_widget()
        self.canvas.pack(side='top', fill='both', expand=1)

def PyplotLineStyles():
    """
    ==========
    Linestyles
    ==========

    This examples showcases different linestyles copying those of Tikz/PGF.
    """
    linestyles = OrderedDict(
        [('solid', (0, ())),
         ('loosely dotted', (0, (1, 10))),
         ('dotted', (0, (1, 5))),
         ('densely dotted', (0, (1, 1))),

         ('loosely dashed', (0, (5, 10))),
         ('dashed', (0, (5, 5))),
         ('densely dashed', (0, (5, 1))),

         ('loosely dashdotted', (0, (3, 10, 1, 10))),
         ('dashdotted', (0, (3, 5, 1, 5))),
         ('densely dashdotted', (0, (3, 1, 1, 1))),

         ('loosely dashdotdotted', (0, (3, 10, 1, 10, 1, 10))),
         ('dashdotdotted', (0, (3, 5, 1, 5, 1, 5))),
         ('densely dashdotdotted', (0, (3, 1, 1, 1, 1, 1)))])

    fig = Figure(figsize=(10, 6))
    ax = fig.add_subplot(1,1,1)

    X, Y = np.linspace(0, 100, 10), np.zeros(10)
    for i, (name, linestyle) in enumerate(linestyles.items()):
        ax.plot(X, Y + i, linestyle=linestyle, linewidth=1.5, color='black')

    ax.set_ylim(-0.5, len(linestyles) - 0.5)
    ax.set_yticks(np.arange(len(linestyles)), linestyles.keys())
    ax.set_xticks([])

    # For each line style, add a text annotation with a small offset from
    # the reference point (0 in Axes coords, y tick value in Data coords).
    reference_transform = blended_transform_factory(ax.transAxes, ax.transData)
    for i, (name, linestyle) in enumerate(linestyles.items()):
        ax.annotate(str(linestyle), xy=(0.0, i), xycoords=reference_transform,
                    xytext=(-6, -12), textcoords='offset points', color="blue",
                    fontsize=8, ha="right", family="monospace")

    fig.tight_layout()
    return fig

layout = [[sg.Canvas(size=(640, 480), key='CANVAS')]]
location = sg.Window.get_screen_size()      # Set window to outside of screen
window = sg.Window('Title', layout, location=location, finalize=True)

fig = PyplotLineStyles()
canvas = Canvas(fig, window['CANVAS'].Widget)   # Create a canvas for matplotlib figure
canvas.draw()                               # Update matplotlib figure to canvas
window.refresh()                            # Update GUI
window.move_to_center()                     # Move window to center of screen
window.read(close=True)
matplotlib.figure.Figure works out when previously using plt.figure.
But how does this apply for plt.subplots()?
is there any wat to use subplots with matplotlib.figure.Figure?
Looking forward for your feedback.
I don't know much about matplotlib. Maybe or maybe not
Figure.add_subplotFigure.add_gridspecFigure.add_axesor- something else.

Even there is issue with using figure. in my case the whole figure get bigger and bigger unitl the expanded widgets are resized to their fixed size and also on each plot the UI gets slower and slower
Can you provide some details @Techmaniac154 of what you're running? It's hard to debug without specifics.
The version numbers of all the components, os, etc, are needed - the tkinter, python matplotlib versions as well as your PySimpleGUI version.
Have you seen this Demo that uses an Image element? I'm wondering if maybe it's using a slightly different approach that may work better in some instances.
https://github.com/PySimpleGUI/PySimpleGUI/blob/master/DemoPrograms/Demo_Matplotlib_Image_Elem.py
You will want to add expand_x and expand_y to the Image element and the pin call and make your window resizable, but otherwise it should work out of the box.
Hardcoding a size on the canvas doesn't make sense since you're wanting expansion. I don't recommend hard-coding anything.
Thank you soo much, it seems that was my mistake, looking around if there are any other issues
Edit: Looking forward if you have any solutions for retaining the same DPI even after the plot
Looking forward if you have any solutions for retaining the same DPI even after the plot
I don't have one.
Hi @PySimpleGUI , @jason990420
I am a lot confused and just sitting blank right now, Requesting your help in identifying and fixing the issue with my code
Operating System - Windows 11,
PyimpleGUI - 4.60.4
matplotlib - 3.6.2
numpy - 1.24.1
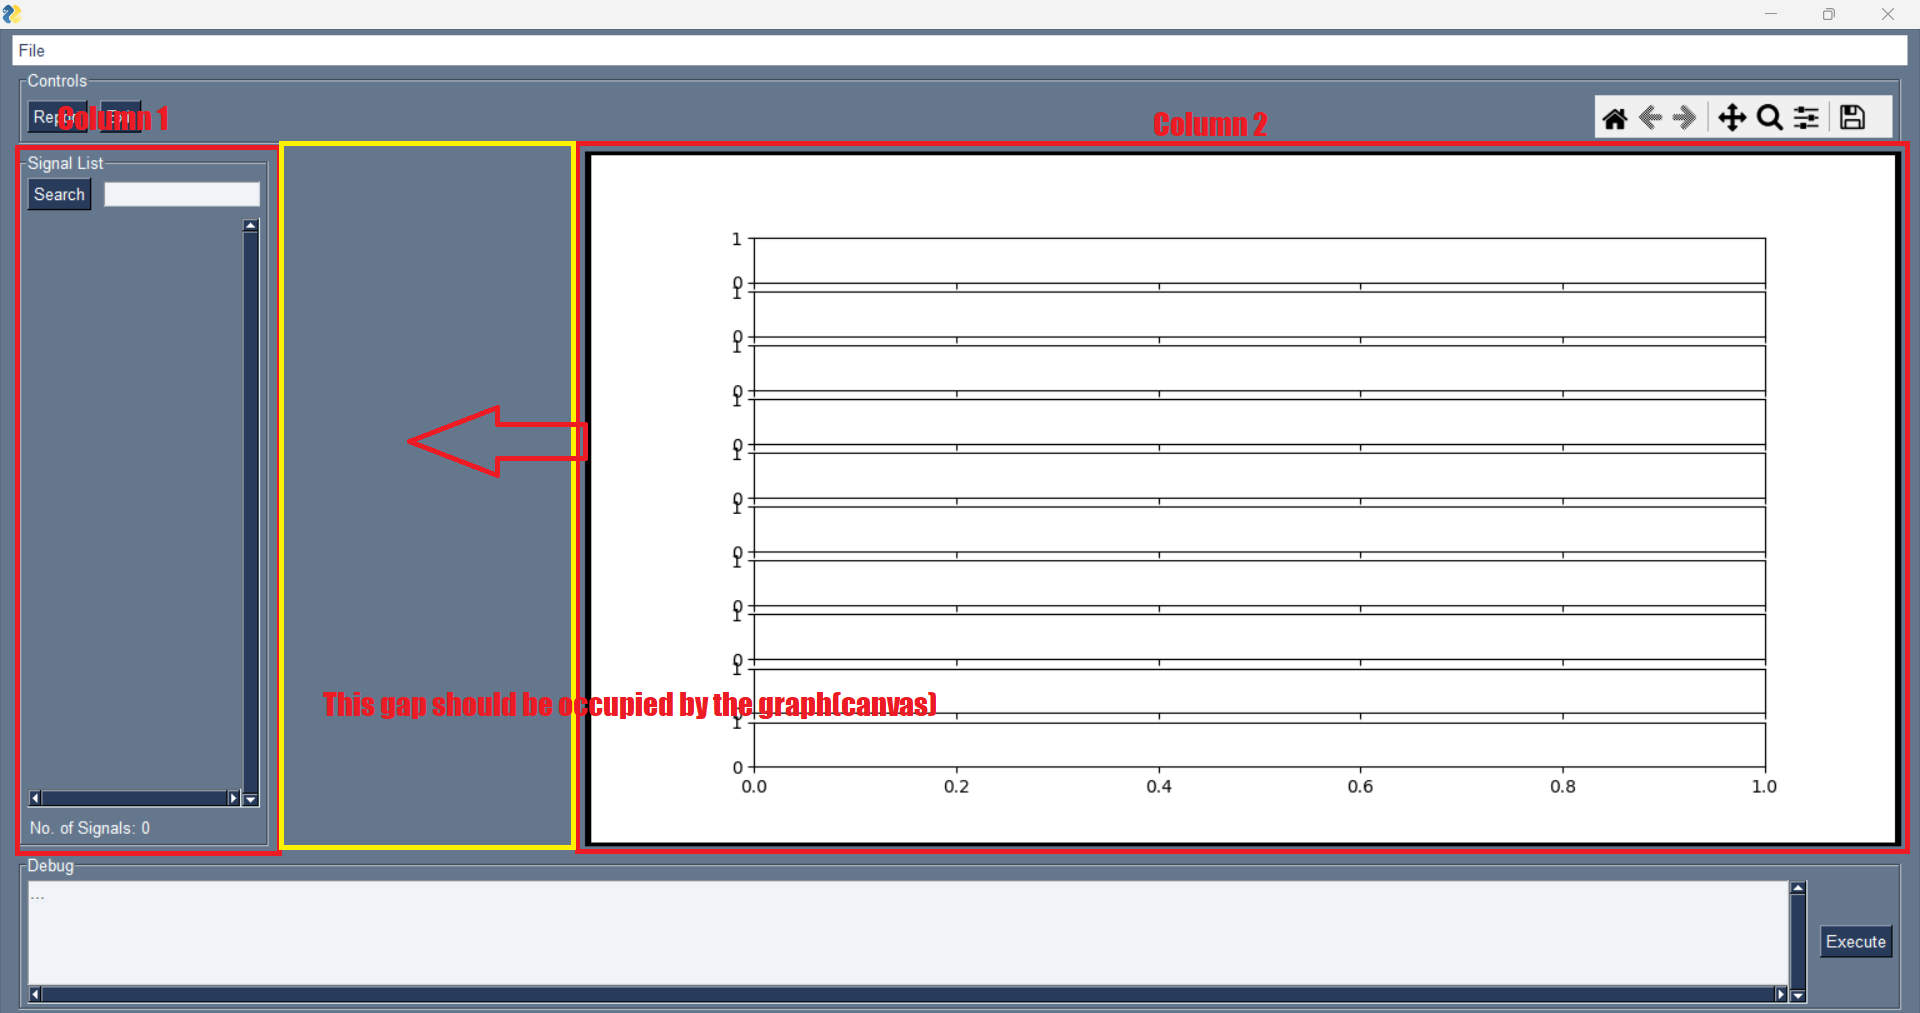
Issue 1 - Initially the screen comes good but then after trying to maximize there exists a gap between the columns. i want the first column(list) to be in fixed size but expand_y alone but the second column(graph) should occupy the rest of the space both in x and y directions
Issue 2 - On trying to manually resize the window size the bottom widgets just gets hidden but it should always be visible on any screen size
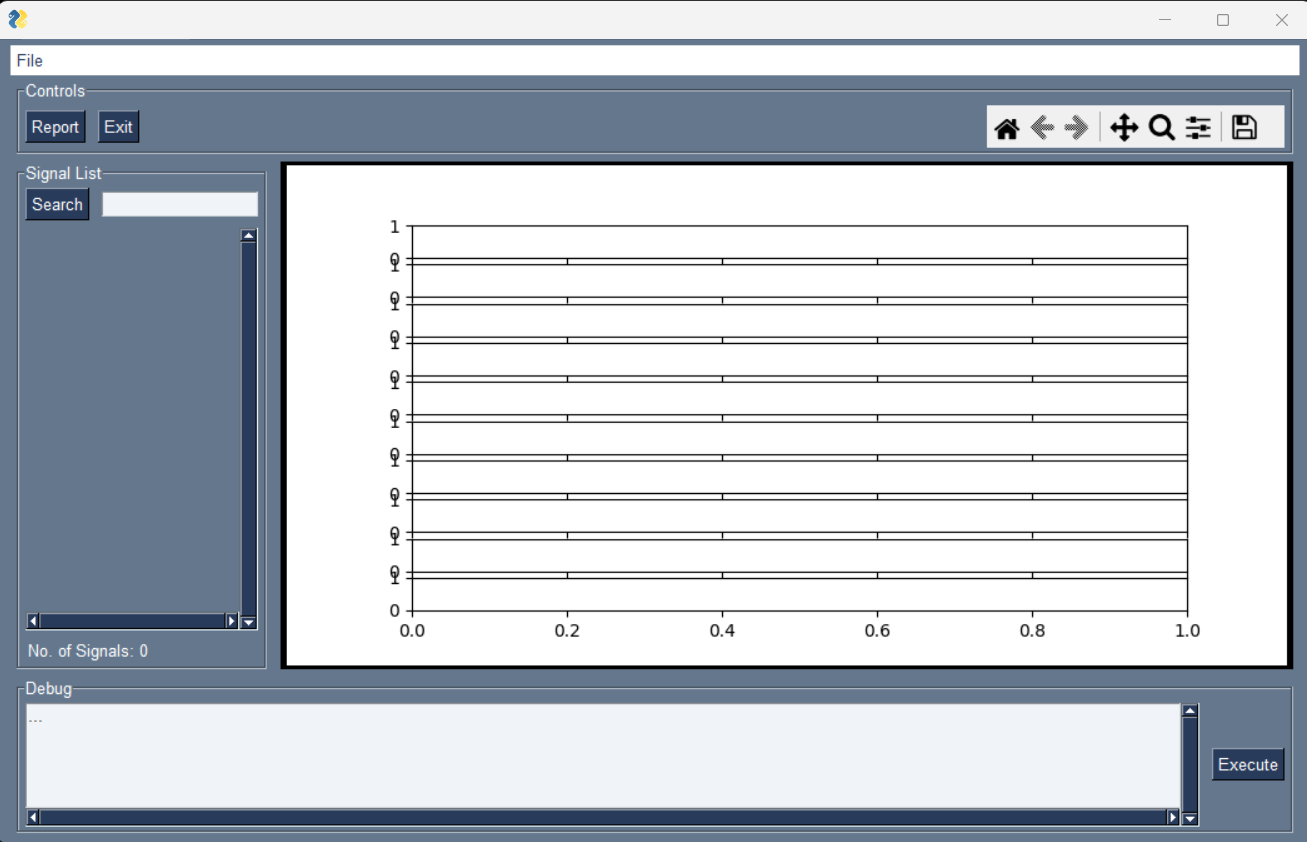
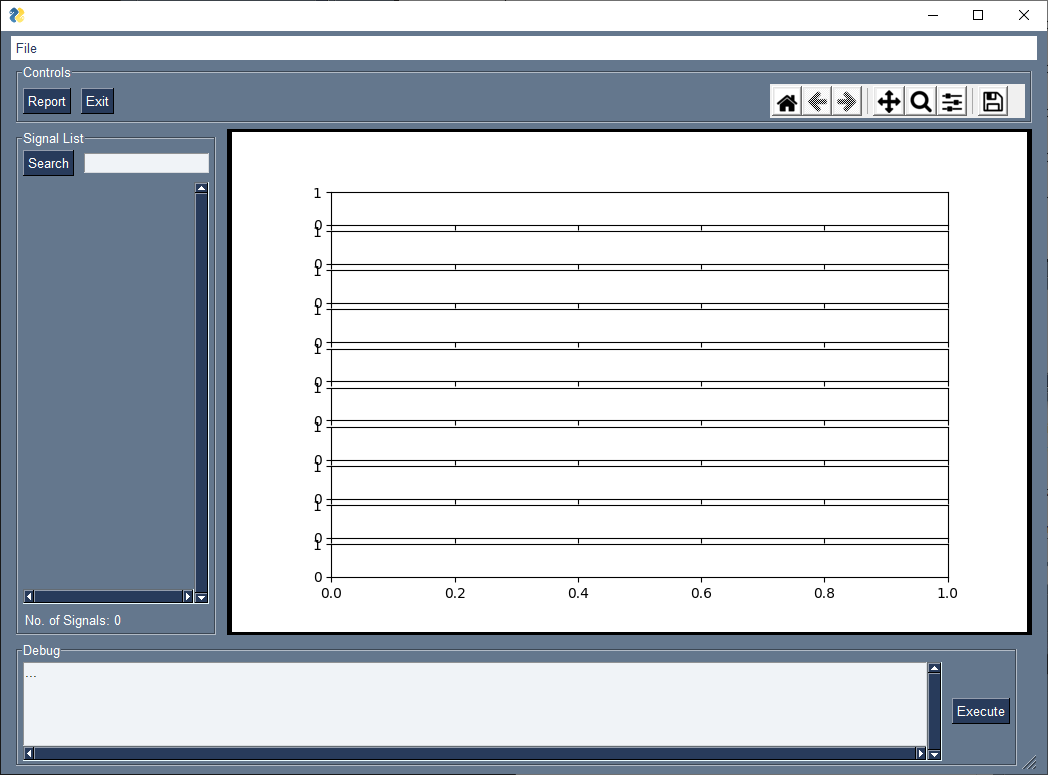
ScreenShots 1 - Initial screen
Screenshot 2 - When maximized there exists a gap between two columns
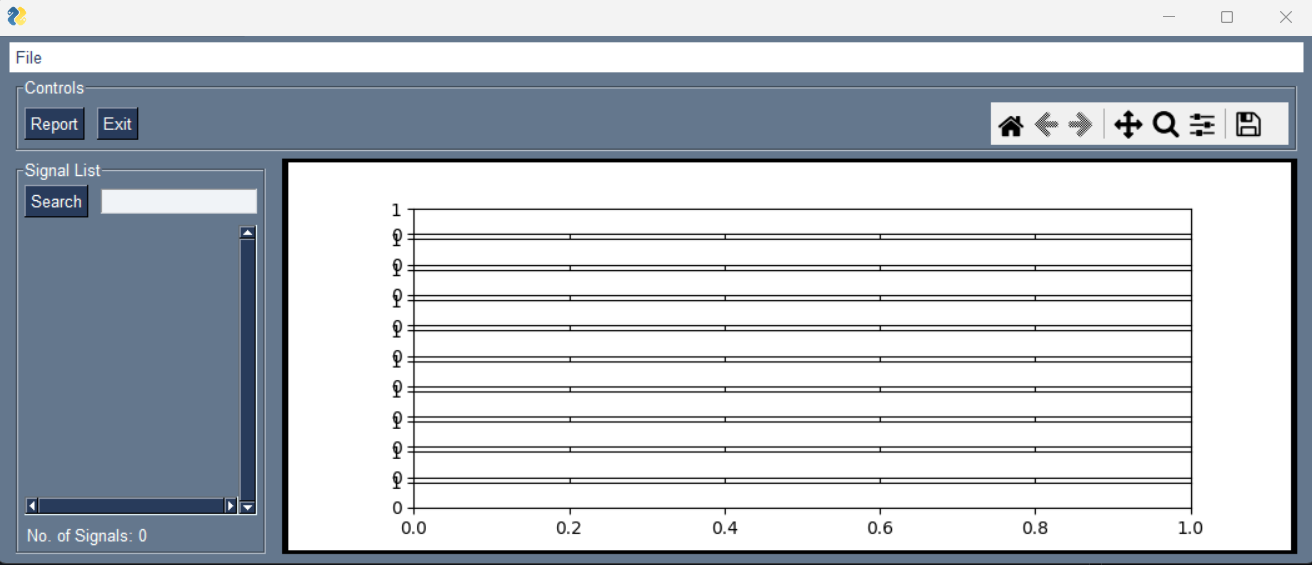
Screenshot 2.a - After making the plot multiple times (the graph grows and autofits to space left) i.e Click report button multiple times

Screenshot 3 - On manually resizing to a small window (Bottom widgets are not visible)
FYI:
sorry for the previous mess up with my questions the major issue was that i used the "Figure" to create a figure in matplotlib as suggested by @jason990420 but in order to make changes to few parameters of the plot i used the "plt" over the fig object i created earlier with "Figure" class that was causing all my major issues i.e change of resolution and DPI
Final Verdict - If someone is facing issue with DPI change or resolution change for matplotlib plots in pysimgplegui even while using "Figure" class from matplotlib make sure that you are not using plt for any kind of changes to figure
Issue 1 - Initially the screen comes good but then after trying to maximize there exists a gap between the columns. i want the first column(list) to be in fixed size but expand_y alone but the second column(graph) should occupy the rest of the space both in x and y directions
Different values, for expand_x and expand_y for the elements on the same row, will get this issue and it's not yet solved.
Issue 2 - On trying to manually resize the window size the bottom widgets just gets hidden but it should always be visible on any screen size
Elements packed later will be reduced first, so last row reduced first in your case.
Revised code as following, need more knowledge about the tkinter pack method and the layout structure of PySimpleGUI, so no comment for it.
import numpy as np
import PySimpleGUI as sg
from matplotlib.figure import Figure
from matplotlib.ticker import MaxNLocator
from matplotlib.backends.backend_tkagg import (FigureCanvasTkAgg,
                                               NavigationToolbar2Tk)

def repack(widget, option):
    pack_info = widget.pack_info()
    pack_info.update(option)
    widget.pack(**pack_info)

max_checkbox_count = 0
def draw_figure_w_toolbar(canvas, fig, canvas_toolbar):
    if canvas.children:
        for child in canvas.winfo_children():
            child.destroy()
    if canvas_toolbar.children:
        for child in canvas_toolbar.winfo_children():
            child.destroy()
    figure_canvas_agg = FigureCanvasTkAgg(fig, master=canvas)
    figure_canvas_agg.draw()
    toolbar = Toolbar(figure_canvas_agg, canvas_toolbar)
    toolbar.update()
    figure_canvas_agg.get_tk_widget().pack(side='top', fill='both', expand=1)

class Toolbar(NavigationToolbar2Tk):

    def __init__(self, *args, **kwargs):
        super(Toolbar, self).__init__(*args, **kwargs)

def generate_gui(cols=[]):
    menu_def = [['File', ['Open', 'Exit']]]

    # signal_list = [[check_box_btn(i)] for i in cols]
    signal_list = [[]]
    signals = [[
        sg.B('Search', k='--SEARCH--', bind_return_key=True),
        sg.InputText(
                    expand_x=True,
                     k='--SEARCH_KEY--',
                     tooltip='Enter part of your signal name to search')
                ],
               [
                   sg.Column(layout=signal_list,
                             scrollable=True,
                             expand_y=True,
                             expand_x=True,
                             k='--SIGNAL_COLUMN--',
                             )
               ],
               [
                   sg.Text(f'No. of Signals: {max_checkbox_count}',
                           k='--SIGNAL_COUNT--',
                           expand_x=True,
                           )
               ]
               ]

    layout = [
        [sg.MenubarCustom(menu_def)],
        [sg.Frame('Controls',
                  size=(None, 60),
                  expand_x=True,
                  layout=[[
                      sg.B('Report'),
                      sg.B('Exit'),
                      sg.Push(),
                      sg.Canvas(key='controls_cv')
                  ]])],
        [
            sg.pin(sg.Frame(k='--SIGNAL_FRAME--',
                     layout=signals,
                     title='Signal List',
                     expand_y=True,
                     expand_x=True,
                     size=(200, None)
                     ),
                     expand_x=True,
                     expand_y=True
            ),
            # sg.pin(
                sg.Column(
                layout=[
                    [
                        sg.Canvas(
                            key='fig_cv',
                            size=(1920/2, 1080/2),  #(W,H)
                            expand_x=True,
                            expand_y=True,
                            background_color='black')
                    ],
                ],
                expand_x=True,
                expand_y=True,
                background_color='black'),
                # expand_x=True,
                # expand_y=True
                # ),
        ],
        [
            sg.Frame(
                title="Debug",
                layout=[
                    [
                        sg.Multiline('...',
                                     expand_x=True,
                                     disabled=True,
                                     write_only=True,
                                     expand_y=True,
                                     autoscroll=True,
                                     horizontal_scroll=True,
                                     size=(None, 5),
                                     k="--DEBUG_OUT--"),
                        sg.B('Execute')
                    ],
                ],
                expand_x=True,
                # expand_y=True,  #size=(None,100)
            ),
        ]
    ]

    return layout


window = sg.Window(
    '',
    layout=generate_gui(cols=[]),
    location=(0, 0),
    resizable=True,
    finalize=True)

fig = Figure((8, 4), 100)
gs = fig.add_gridspec(10)
axs = gs.subplots(sharex=True)

draw_figure_w_toolbar(window['fig_cv'].TKCanvas, fig,
                              window['controls_cv'].TKCanvas)

# masters for parent widget, there're lot of hidden row Frames, `pin` frames, `Frame` frames and `Column` frames in the layout.

repack(window['--SIGNAL_FRAME--'].widget.master.master, {'fill':'y', 'expand':0, 'before':window['fig_cv'].widget.master.master})
repack(window["--DEBUG_OUT--"].widget.master.master.master.master, {'side':'bottom'})
repack(window['--SIGNAL_FRAME--'].widget.master.master.master, {'side':'top'})

while True:
    event, values = window.read()
    if event in (sg.WIN_CLOSED, 'Exit'):
        break
    elif event.lower() == 'report':
        x = np.linspace(0, 20 * np.pi)
        y = np.sin(x) * 10
        # plt.xticks(np.arange(min(x), max(x) + 40, 1))
        axs[0].plot(x, y, '.')
        axs[1].step(x, y)
        draw_figure_w_toolbar(window['fig_cv'].TKCanvas, fig,
                              window['controls_cv'].TKCanvas)
        window.refresh()

window.close()Screenshot 2
The problem I see in Screenshot 2 is that in order to fill the space, the element/graph/item need to be able to be "stretched" in one direction, the X-axis, without changing the Y-axis. If you think about this being a photograph, there are 2 options, you can stretch the image in an unnatural way, changing the ratio of the photo or you can resize it by cropping off the top and bottom of the image. This kind of operation is not done automatically for you for an Image element for example.
Perhaps Matplotlib automatically rescales the graph to fit the space. I'm not an expert in Matplotlib, that's for certain. Like all packages that integrate with PySimpleGUI, the techniques are shown via Demo Programs because they're not core features of PySimpleGUI, they are other libraries that you can integrate to work with PySimpleGUI.
I wish that I had the ability to debug and help every user with their code, but I don't. The last thing I want to see happen is for there to be confusion where users are stopped, waiting for assistance that I'm not able to provide at the moment.
SizeGrip tip
If you find that you're manually resizing the window often, you may like having a SizeGrip on your window.
I simply added one to the last row of your layout:
            ),
            sg.Sizegrip()
        ]
    ]
It makes grabbing the lower right corner much easier.
SizeGrip on new row
Or you can also put the SizeGrip on a row by itself. Because you've got a MenubarCustom in your layout, it's recommended to set the Window's margins to (0,0) so that the Menubar will be up against the Titlebar.
Here's the result of this change to your layout and to your Window
        ],
        [sg.Sizegrip()]
    ]

    return layout


window = sg.Window(
    '',
    layout=generate_gui(cols=[]),
    location=(0, 0),
    resizable=True,
    finalize=True,
    margins=(0,0))
Thank you so much @jason990420 but
is there any way to fix issue 2 ??
and also if possible can you help me suggesting an idea
Issue 1 - Initially the screen comes good but then after trying to maximize there exists a gap between the columns. i want the first column(list) to be in fixed size but expand_y alone but the second column(graph) should occupy the rest of the space both in x and y directions
Different values, for
expand_xandexpand_yfor the elements on the same row, will get this issue and it's not yet solved.Issue 2 - On trying to manually resize the window size the bottom widgets just gets hidden but it should always be visible on any screen size
Elements packed later will be reduced first, so last row reduced first in your case.
Revised code as following, need more knowledge about the tkinter
packmethod and the layout structure of PySimpleGUI, so no comment for it.
Thank you @jason990420 I had this repack function defined previously(from one of your comments) but was not sure about using it but thanks for pointing it out to me
regarding my issue 2 is there any way to fix it
and finally i know you have already mentioned that you are not that great in matplotlib but still, I am trying to make subplots with matplotlib but the constraint is that number of rows in the subplot I want it dynamically changed say for instance I have declared 5 list's each containing some values in it within the GUI i have check box which when selcted will display the selected number of rows plotted within the subplot
i am certain that i need to make use of the add_subplot method but not exactly sure how to make use of it because its causing the images to merge with each
@PySimpleGUI Your comments are very much appreciated, it's so amazing to have your support, regarding the sizeGrip, yes iam actually using that in my development did not mention in the code i shared but still thank you so much for your valuable suggestions
Issue 2 - On trying to manually resize the window size the bottom widgets just gets hidden but it should always be visible on any screen size
It already solved by following code in my code, did you check it ?
repack(window["--DEBUG_OUT--"].widget.master.master.master.master, {'side':'bottom'})
repack(window['--SIGNAL_FRAME--'].widget.master.master.master, {'side':'top'})
Hi Thanks
@jason990420 sorry yes it was already fixed, thanks a lot
Finally one small request from my end - @jason990420 , @PySimpleGUI can you please remove the screenshots and the codes from the comments added? just making sure this code should be out of plagiarism tests. its very important to hide the application design screenshots and codes
Thanks again both @jason990420 and @PySimpleGUI