
Remember: It's all about the looks.

MPAndroidChart is a powerful & easy to use chart library for Android, supporting line-, bar-, scatter-, candlestick-, bubble-, pie- and radarcharts (spider web), as well as scaling, dragging (panning), selecting and animations. Works on Android 2.2 (API level 8) and upwards.
An iOS version of this library is now available, go check it out: ios-charts
Are you using this library? Let me know about it and I will add your project to the references.
Donations
This project needs you! If you would like to support this project's further development, the creator of this project or the continuous maintenance of this project, feel free to donate. Your donation is highly appreciated (and I love food, coffee and beer). Thank you!
PayPal
- [Donate 5 $] (https://www.paypal.com/cgi-bin/webscr?cmd=_s-xclick&hosted_button_id=7G52RA87ED8NY): Thank's for creating this project, here's a coffee (or some beer) for you!
- [Donate 10 $] (https://www.paypal.com/cgi-bin/webscr?cmd=_s-xclick&hosted_button_id=4C9TPE67F5PUQ): Wow, I am stunned. Let me take you to the movies!
- [Donate 15 $] (https://www.paypal.com/cgi-bin/webscr?cmd=_s-xclick&hosted_button_id=YKMPTFMVK3JMC): I really appreciate your work, let's grab some lunch!
- [Donate 25 $] (https://www.paypal.com/cgi-bin/webscr?cmd=_s-xclick&hosted_button_id=H9JA4QX7UHXCY): That's some awesome stuff you did right there, dinner is on me!
- [Donate 50 $] (https://www.paypal.com/cgi-bin/webscr?cmd=_s-xclick&hosted_button_id=ZPQVJ2XRBSBYY): I really really want to support this project, great job!
- [Donate 100 $] (https://www.paypal.com/cgi-bin/webscr?cmd=_s-xclick&hosted_button_id=KY7F59RYPCYCQ): You are the man! This project saved me hours (if not days) of struggle and hard work, simply awesome!
- Of course, you can also choose what you want to donate, all donations are awesome!
Spread the word
![]()
![]()
![]()
Follow me on Twitter: @PhilippJahoda
Contact me on LinkedIn: PhilippJahoda
Look me up on StackOverflow: Philipp Jahoda
Demo
For a brief overview of the most important features, please download the PlayStore Demo MPAndroidChart Example.apk and try it out. The corresponding code for the demo-application is also included in this repository inside the MPChartExample folder.

Questions & Issues
If you are having questions or problems, you should:
- Make sure you are using the latest version of the library. Check the release-section.
- Study the Documentation-Wiki or the javadocs
- Search or open questions on stackoverflow with the
mpandroidcharttag - Search known issues for your problem (open and closed)
- Create new issues (please search known issues before, do not create duplicate issues)
Features
Core features:
- 8 different chart types
- Scaling on both axes (with touch-gesture, axes separately or pinch-zoom)
- Dragging / Panning (with touch-gesture)
- Combined-Charts (line-, bar-, scatter-, candle-data)
- Dual (separate) Y-Axis
- Finger drawing (draw values into the chart with touch-gesture)
- Highlighting values (with customizeable popup-views)
- Multiple / Separate Axes
- Save chart to SD-Card (as image, or as .txt file)
- Predefined color templates
- Legends (generated automatically, customizeable)
- Customizeable Axes (both x- and y-axis)
- Animations (build up animations, on both x- and y-axis)
- Limit lines (providing additional information, maximums, ...)
- Fully customizeable (paints, typefaces, legends, colors, background, gestures, dashed lines, ...)
- Smooth zooming and scrolling for up to 30.000 data points in Line- and BarChart
Chart types:
-
LineChart (with legend, simple design)
-
LineChart (with legend, simple design)
-
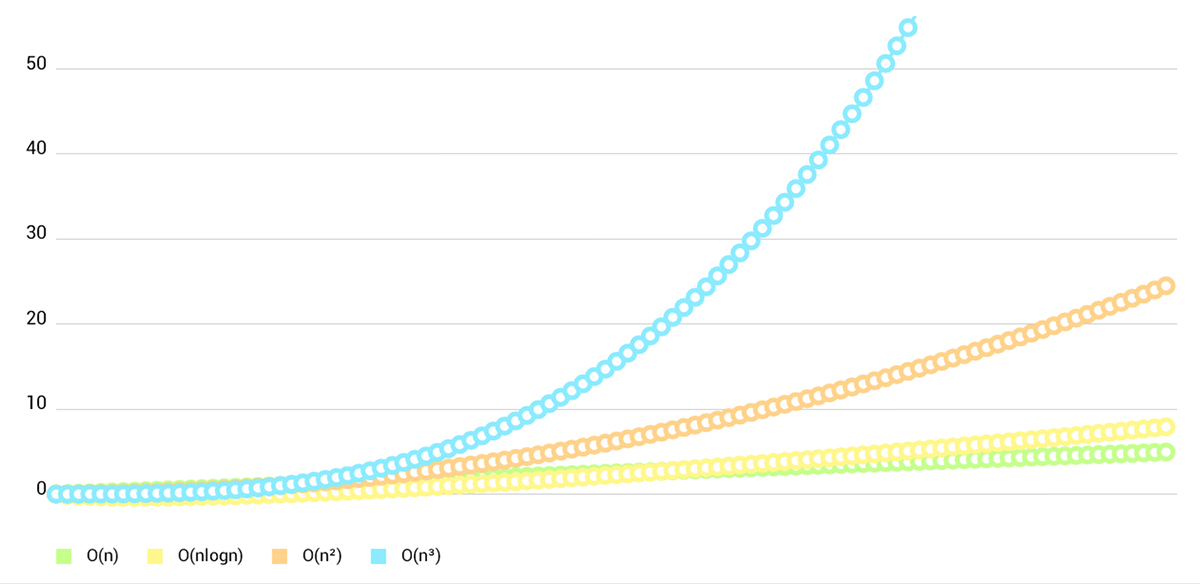
LineChart (cubic lines)
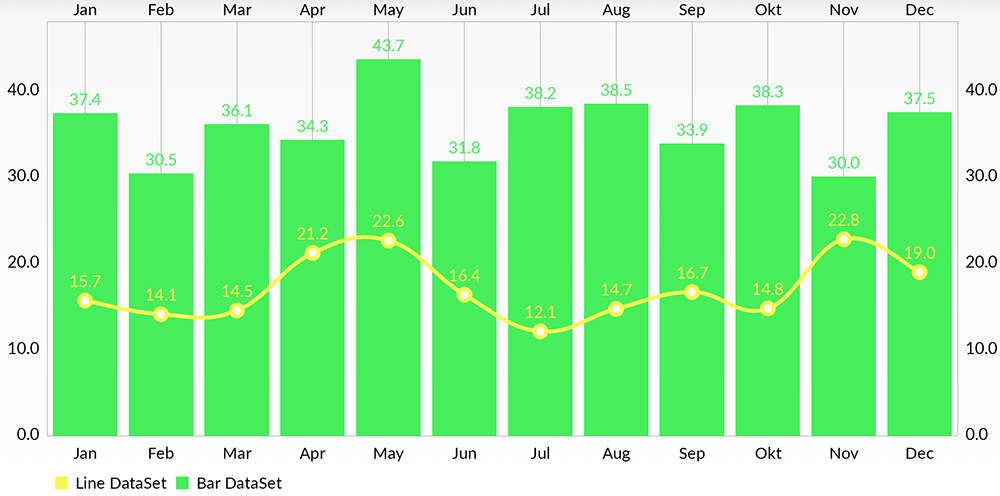
-
Combined-Chart (bar- and linechart in this case)
-
BarChart (with legend, simple design)


- BarChart (grouped DataSets)

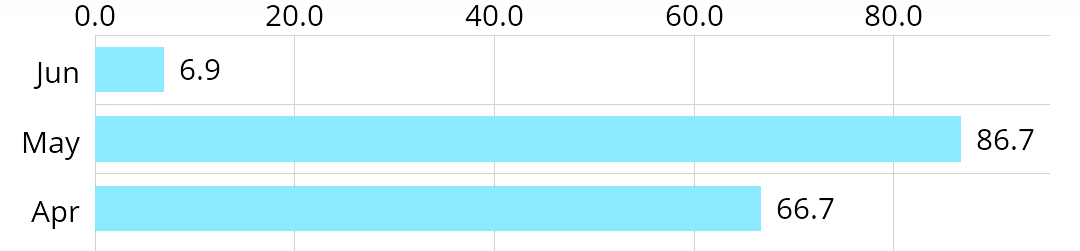
- Horizontal-BarChart
- PieChart (with selection, ...)

- ScatterChart (with squares, triangles, circles, ... and more)

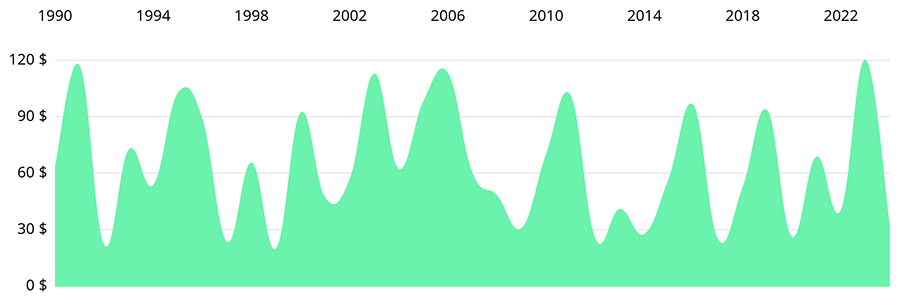
- CandleStickChart (for financial data)

- BubbleChart (area covered by bubbles indicates the value)

- RadarChart (spider web chart)

Usage
In order to use the library, there are 4 options:
1. Gradle dependency
- Add the following to your
build.gradle:
repositories {
       maven { url "https://jitpack.io" }
}

dependencies {
       compile 'com.github.PhilJay:MPAndroidChart:v2.1.5'
}
2. Maven
- Add the following to your
pom.xml:
<repository>
      	<id>jitpack.io</id>
       <url>https://jitpack.io</url>
</repository>

<dependency>
       <groupId>com.github.PhilJay</groupId>
       <artifactId>MPAndroidChart</artifactId>
       <version>v2.1.5</version>
</dependency>
3. jar file only
- Download the latest .jar file from the releases section
- Copy the mpandroidchartlibrary-version.jar file into the
libsfolder of your Android application project - Start using the library
4. clone whole repository
- Open your commandline-input and navigate to your desired destination folder (where you want to put the library)
- Use the command
git clone https://github.com/PhilJay/MPAndroidChart.gitto download the full MPAndroidChart repository to your computer (this includes the folder of the library project as well as the example project) - Import the library folder (
MPChartLib) into Android Studio or your Eclipse workspace - Add it as a reference to your project:
Documentation
For a detailed documentation, please have a look at the Wiki or the javadocs.
Furthermore, you can also rely on the MPChartExample folder and check out the example code in that project. The corresponding application to the example project is also available in the Google PlayStore.
You have a problem that cannot be solved by having a look at the example project and documentation?
No problem, let's talk:

License
Copyright 2015 Philipp Jahoda
Licensed under the Apache License, Version 2.0 (the "License"); you may not use this file except in compliance with the License. You may obtain a copy of the License at
http://www.apache.org/licenses/LICENSE-2.0
Unless required by applicable law or agreed to in writing, software distributed under the License is distributed on an "AS IS" BASIS, WITHOUT WARRANTIES OR CONDITIONS OF ANY KIND, either express or implied. See the License for the specific language governing permissions and limitations under the License.
Special thanks to danielgindi, mikegr, ph1lb4 and jitpack.io for their contributions to this project.