Fork https://github.com/CymaticLabs/InfluxDBStudio
InfluxDB Studio is a UI management tool for the InfluxDB time series database.
Its inspiration comes from other similar database management tools such as SQL Server Management Studio and Robomongo. Under the hood it's powered by InfluxData.Net which is a portable InfluxDB client library for .NET (plus some Kapacitor support). InfluxDB Studio presently implements interfaces and workflows for most of the InfluxData.Net API.
The following are planned features that are not yet implemented in the current version:
Retention Policy managementimplemented, but not documentedCustom stats view for server stats (diagnostics is presently supported)implemented, but not documentedListing currently running queriesimplemented, but not documentedStopping long running queriesimplemented, but not documented- An interface for writing point data directly to the database
- Installation
- Managing Connections
- Connecting to a Server
- Working with Connections
- Working with Databases
- Working with Measurements and Series
- Working with Users and Privileges
- Application Settings
- License
Binary releases can be found here.
You can build locally by downloading the source or cloning the repository. Eventually some binary releases might be included with the repository going forward. To build, you will need Visual Studio 2015. Building with Mono might be possible with additional steps but it's not clear how usable it will be. The Mac OS X version definitely has some issues. For now, Windows is the recommended platform to use.
Open the solution file CymaticLabs.InfluxDB.sln to get started.
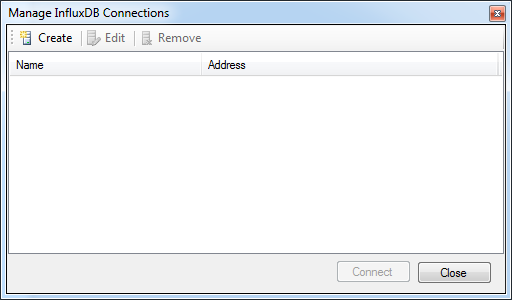
Upon running InfluxDBStudio.exe you will be prompted with the Manage Connections dialog. This window will let you create, edit, and delete InfluxDB server connections.
Press the Create button to add your first InfluxDB connection using the Connection Setting dialog.
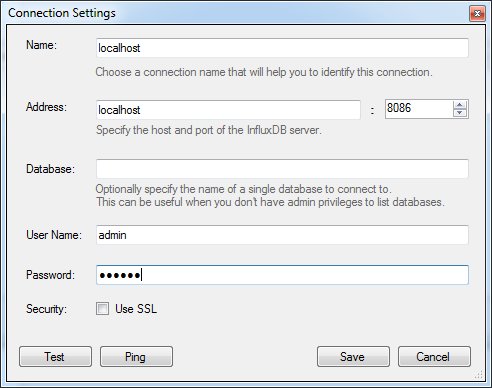
Use the Connection Settings dialog to configure the details of the InfluxDB connection:
- Name - The name of the connection. This is the label you will see when working with this connection.
- Address - The InfluxDB server's host URI. Exclude protocol information. Port is filled in to the right.
- Database - The database to use for the connection. Leave this blank to list all databases (requires admin privileges).
- Username - The InfluxDB username to use with the connection.
- Password - The InfluxDB password to use with the connection.
- Use SSL - Whether or not to use SSL security (HTTPS) when connecting to InfluxDB.
The Test button to lets you test the connection to InfluxDB using the provided connection details.
The Ping button lets you ping the InfluxDB server and check response time and server version.
Press the Save button to create or update the connection information.
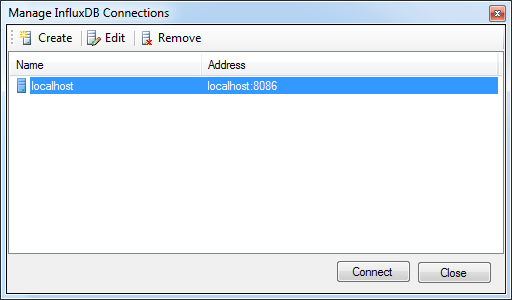
Once you have created at least one connection, select it in the Manage Connections dialog and press the Connect buton.
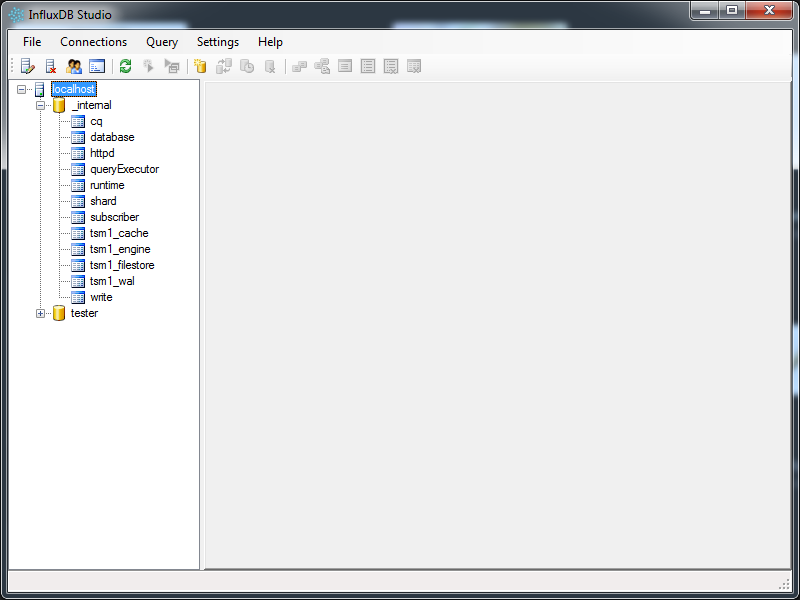
After pressing the Connect button you will see the the main application window. The list of active connection(s) is located in the tree view to the left. This window is where perform most of your interactions with the various InfluxDB connections that you have chosen to connect to. You can launch the Manage Connections dialog again at any time by pressing the toolbar button in the top-left corner or by selecting from the application menu Connections → Manage.
Explore databases and measurements by using the tree view in the left panel.
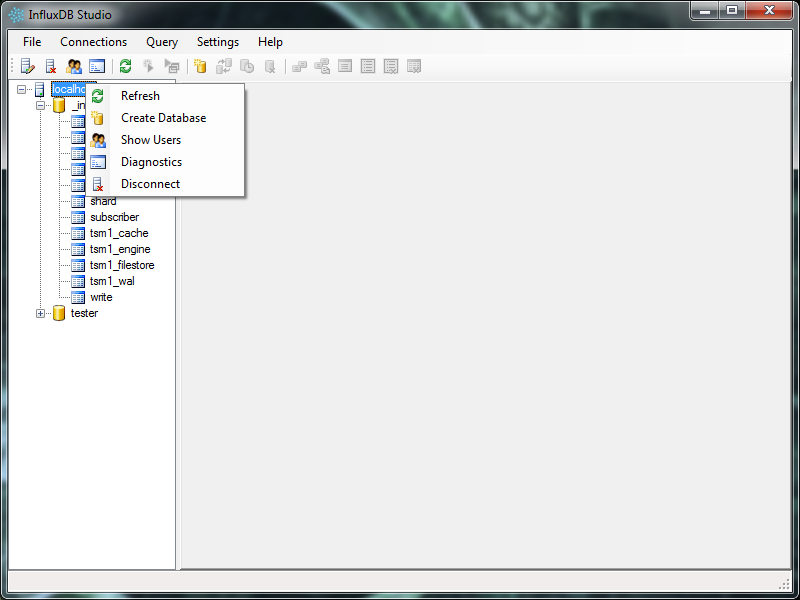
Right-click when you have a Connection node selected in the tree view. You will see a context menu of available commands for the server. These commands are also available at the top of the application in the toolbar. Find the corresponding toolbar button by matching its icon to the context menu command.
The following connection commands are available:
- Refresh - Refreshes the connections data; refetches database information from the server.
- Create Database - Creates a new database on the server.
- Show Users - Lists users on the server and provides a user management interface.
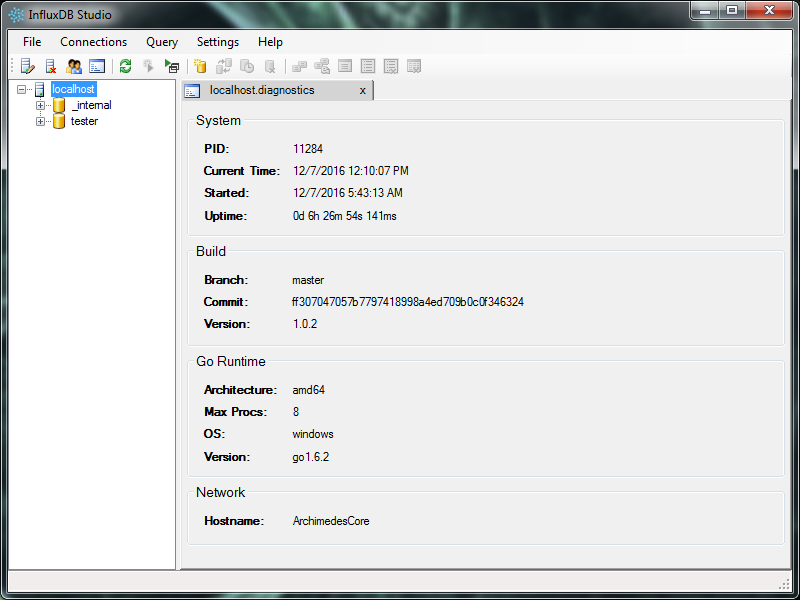
- Diagnostics - Shows server diagnostics including runtime, version, uptime, etc.
- Disconnect - Closes the connection and removes it from the active connection list.
To show connection diagnostics right-click or use the toolbar button to select the Show Diagnostics command:
The following commands are available from the Database context menu and toolbar buttons:
- Refresh - Refreshes the database data; refetches measurement/series information from the server.
- New Query - Opens a new query tab where you can run custom queries and explore the results.
- Show Continuous Queries - Allows you to list, create, and delete Continuous Queries for the database.
- Run Backfill - Lets your run a Backfill Query that downsamples or processes data into new measurements.
- Drop Database - Drops the current database from the server.
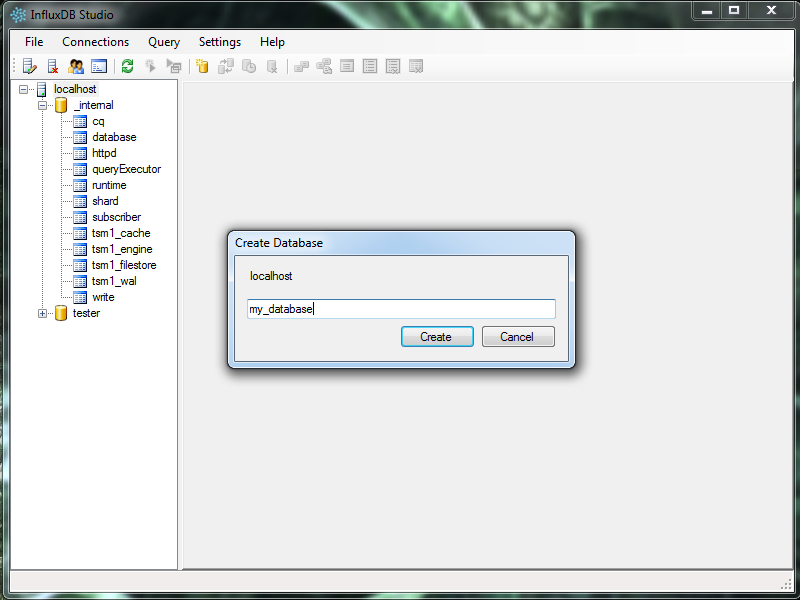
To create a database, select the Connection where you would like to create the database and select Create Database from the context menu or the toolbar button. Next provide the name for the database to create and press the Create button:
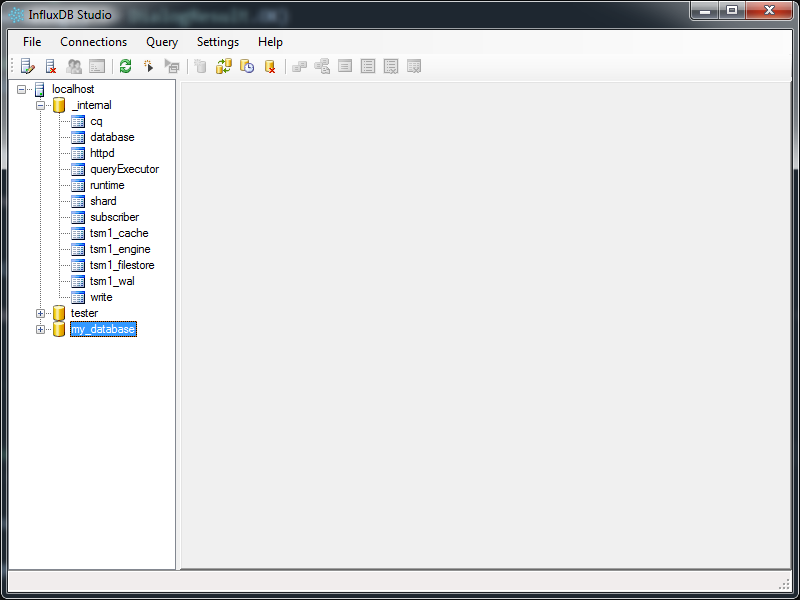
The created database should now appear in the tree view on the left:
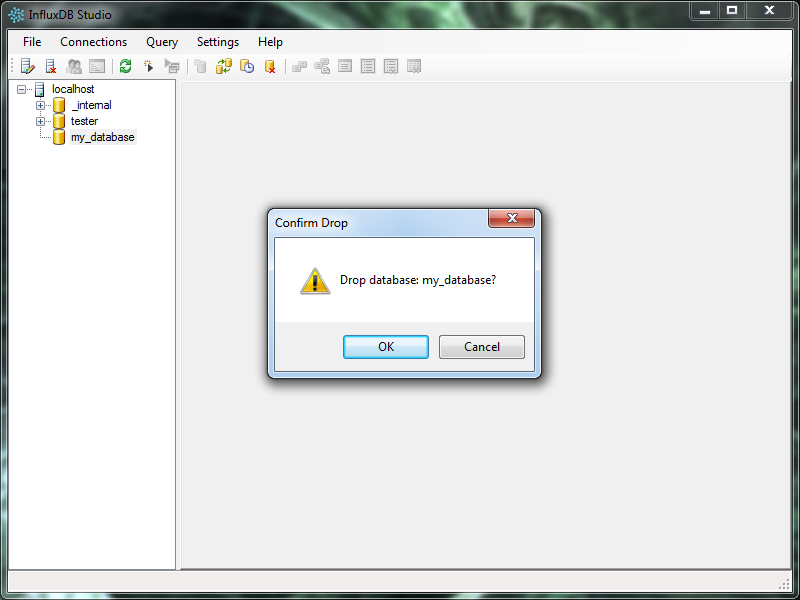
To drop a database, select it in the tree view on the left. Then right-click or use the toolbar button and select Drop Database:
Confirm that you would like to drop the selected database (this is a permanent operation).
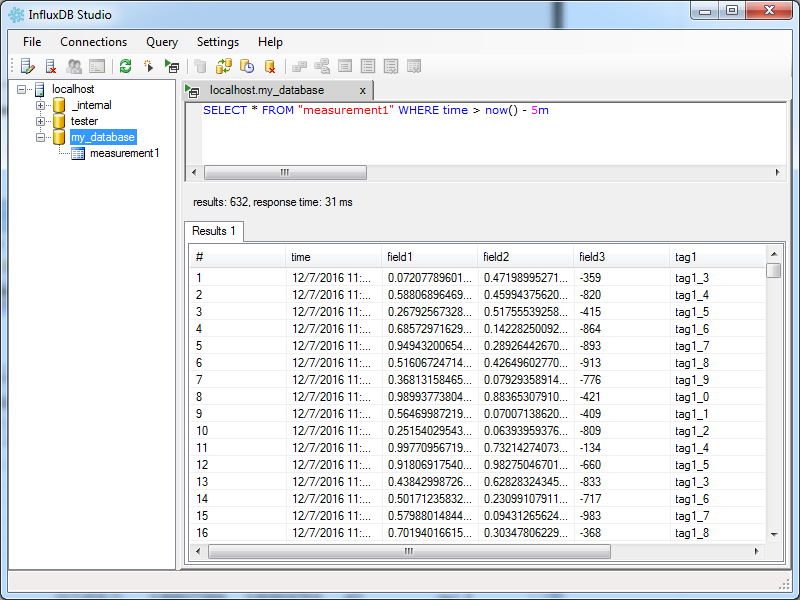
Select a database node in the tree view and either double-click, right-click, use the toolbar button, or select from the application menu Query → New to select the New Query command.
Press CTRL+R, the toolbar button, or select from the application menu Query → Run to run the query. Results will be displayed in the table area below:
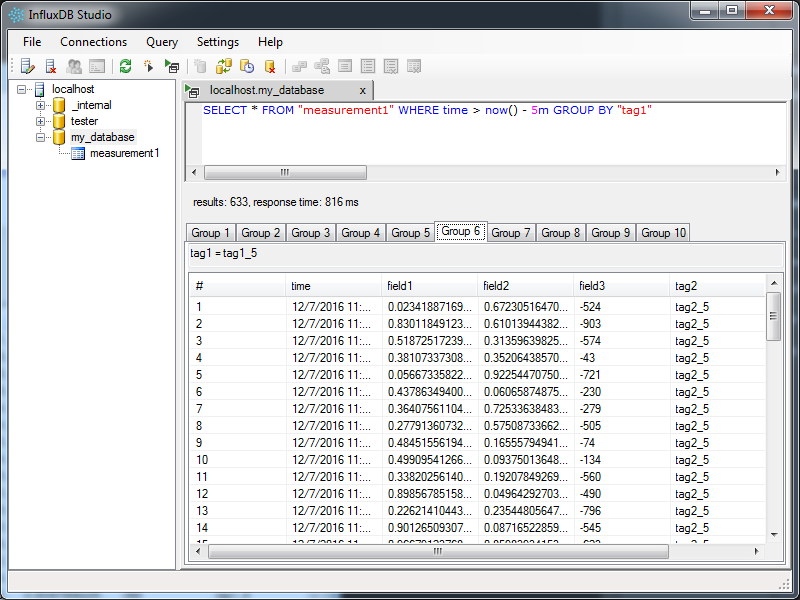
Using aggregation (GROUP BY) in queries will group the series results into their own tabs in the results area:
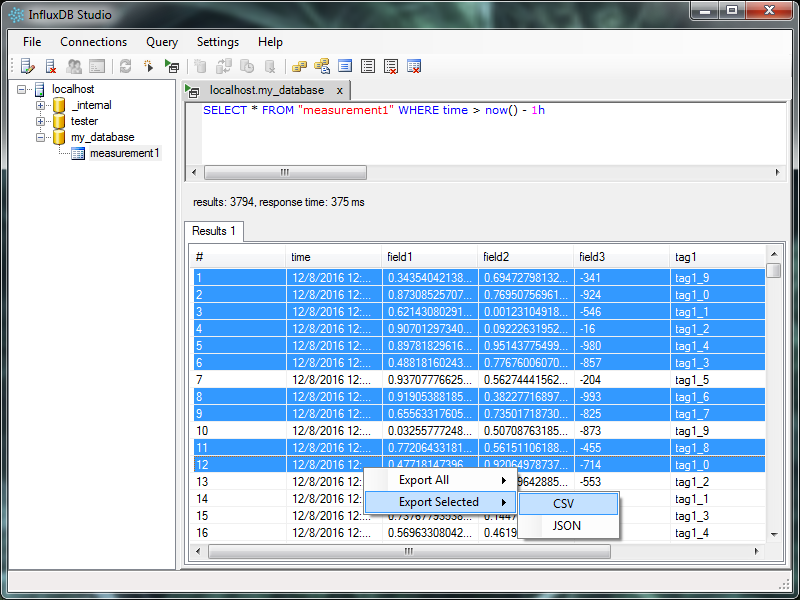
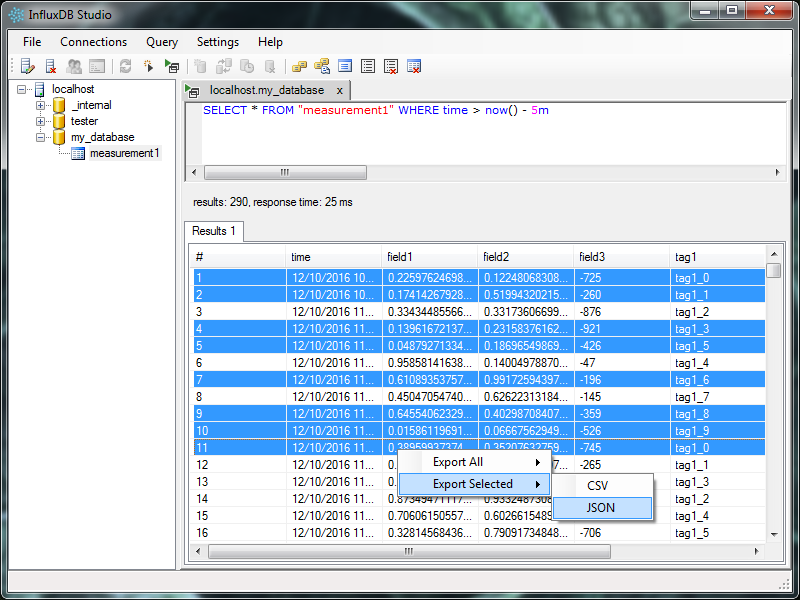
The results of most query windows in InfluxDB Studio can be exported to file. Right-click in the results table and choose from the available export options. Data can be exported in either CSV or JSON format. Choosing Export All will export the entire set of returned rows to file. Alternatively you can export just the selected rows by using CTRL + Left Click and Shift + Left Click to select the rows you want to export and then choosing Export Selected in the export context menu.
Continious Queries run at an interval that you specify and are often used to downsample data by averaging it or processing it as it streams in and dumping the downsample data into a new measurement.
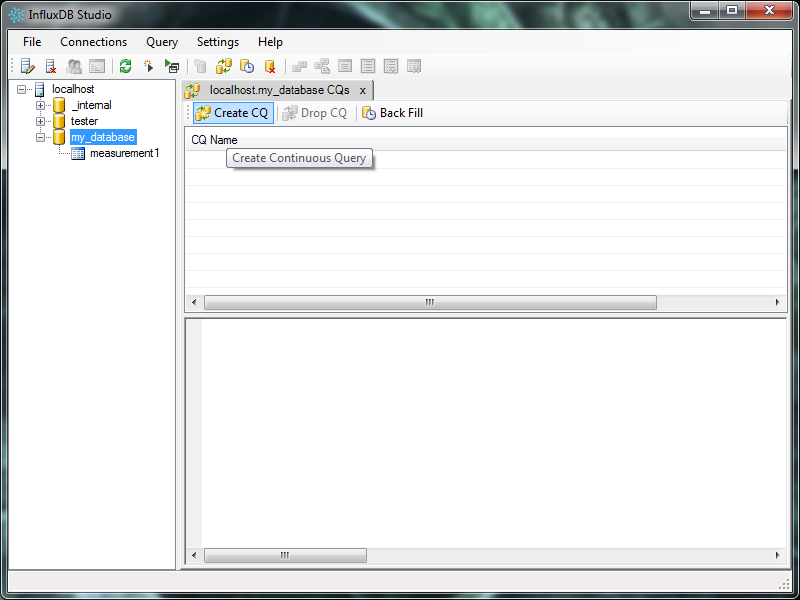
To create and manage Continuous Queries, right-click or use the toolbar button and select the Show Continuous Queries command.
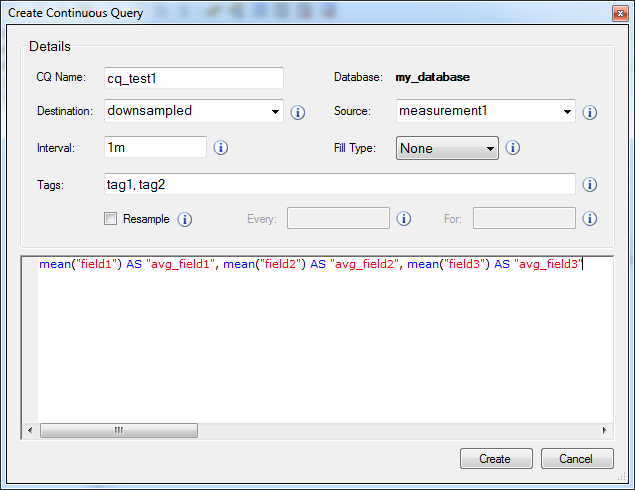
Once the CQ tab opens, click the Create CQ button which will bring up the Create Continuous Query Dialog.
Use the dialog to design a new Continuous Query. Mouse over the help tool tips to learn more about the different form values.
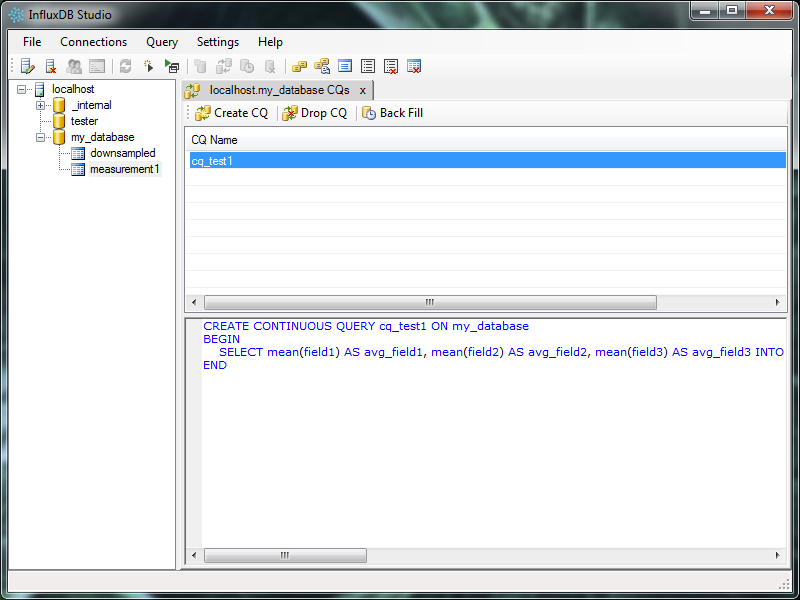
Once you are satisified with your CQ press the Create button to create and run your query. You can verify that the CQ is working by running queries against its destination measurement and exploring the data:
Backfill Queries are similar to Continuous Queries in that they are typically used to process or downsample data from one measurement into another. The difference is that where as Continuous Queries run in realtime at a fixed interval and process incoming data inside a user-specified rolling time window, Backfill Queries are typically only run once on older measurment data that is already stored in the database and outside of the CQ time window.
For example: imagine that you decided you needed to start downsampling data that you've already been collecting for months. You could create a Continuous Query that would downsample the data every hour and average it on all new, incoming data. However since that would only begin downsampling new data, you might also consider running a Backfill Query on the older historic data so that all data becomes downsampled both backwards and forwards through time.
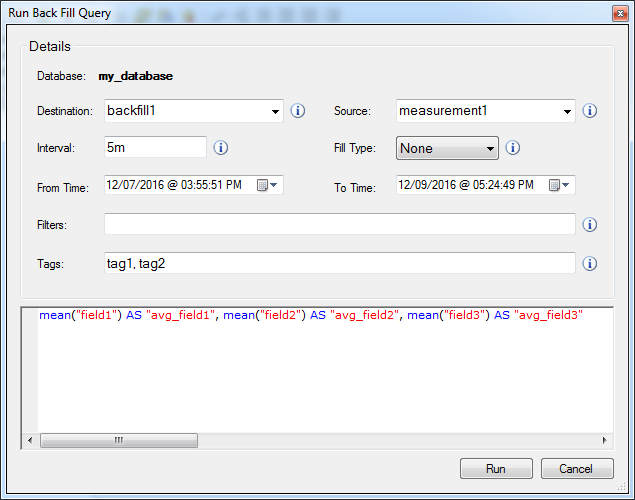
To run a Backfill Query either right-click or click the toolbar button and select Run Backfill. The Run Backfill Query Dialog will open:
Use the dialog to design a Backfill Query. Mouse over the help tool tips to learn more about the different form values.
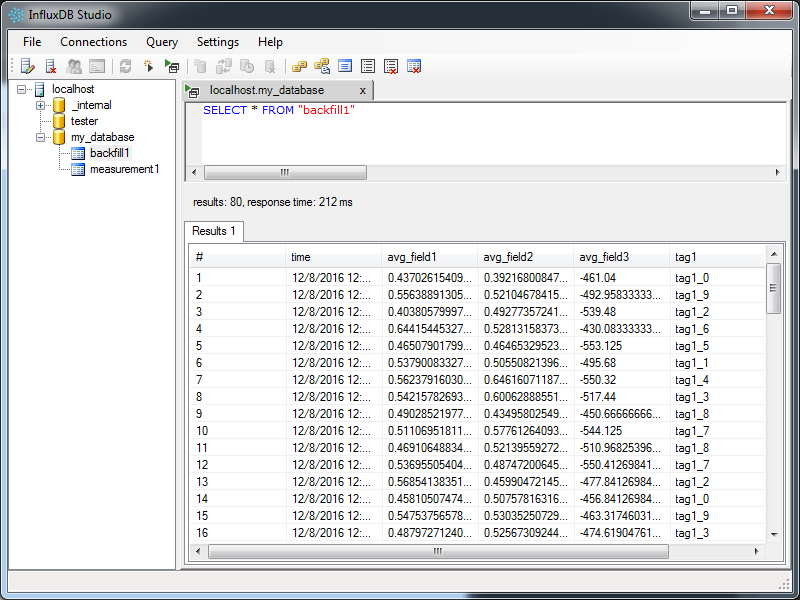
Click the Run button when you are ready to run the backfill. Unless you receive an error message, the query has successfully run. Check to see that the data exists in the destination measurement as expected:
If you don't see any data or your destination measurement was not created check your time ranges to make sure the Backfill Query did not operate on an empty result set.
The following commands are available from the Measurement context menu and toolbar buttons:
- New Query - Opens a new query tab where you can run custom queries and explore the results.
- Show Tag Keys - Lists all tag names/keys that exist for the selected measurement/series.
- Show Tag Values - Lets you explore the values of all tags keys.
- Show Field Keys - Lists the names/keys of all fields in the measurement as well as their data types.
- Show Series - Lists all Series that exist under the selected measurement.
- Drop Measurement - Drops the selected measurement from the database.
- Drop Series - Leaves the measurement but drops all series data from it.
Select a measurement node in the tree view and either double-click, right-click, use the toolbar button, or select from the application menu Query → New to select the New Query command.
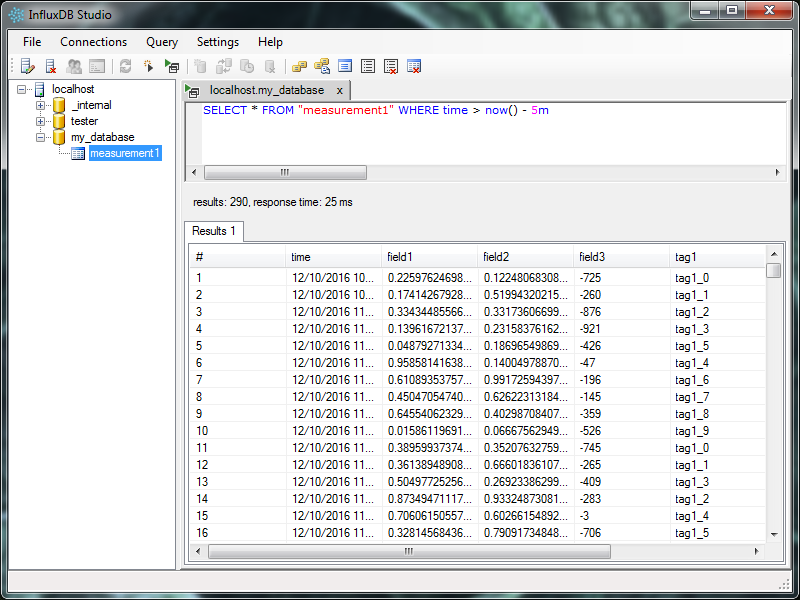
Press CTRL+R, the toolbar button, or select from the application menu Query → Run to run the query. Results will be displayed in the table area below:
Using aggregation (GROUP BY) in queries will group the series results into their own tabs in the results area:
The results of most query windows in InfluxDB Studio can be exported to file. Right-click in the results table and choose from the available export options. Data can be exported in either CSV or JSON format. Choosing Export All will export the entire set of returned rows to file. Alternatively you can export just the selected rows by using CTRL + Left Click and Shift + Left Click to select the rows you want to export and then choosing Export Selected in the export context menu.
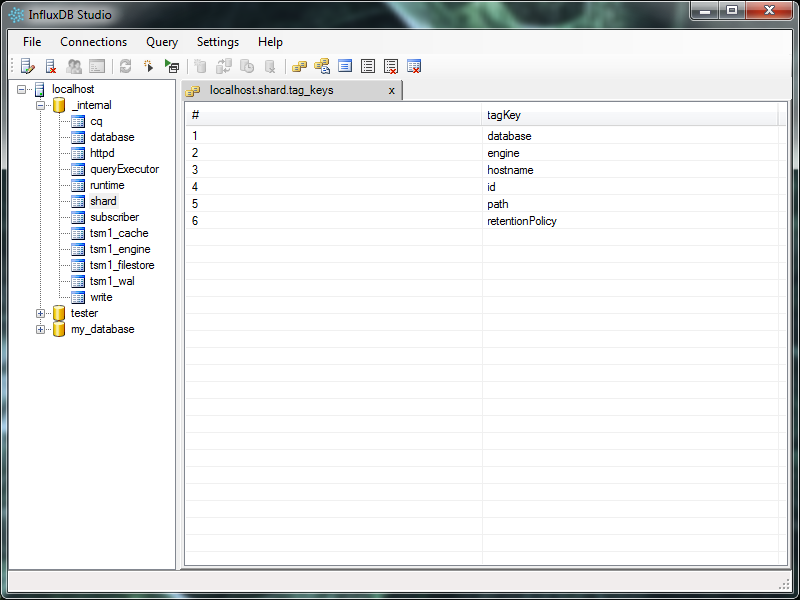
Select a measurement node in the tree view and either right-click or use the toolbar button and select Show Tag Keys:
Tag keys can be exported by right-clicking in the results area and using the export context menu.
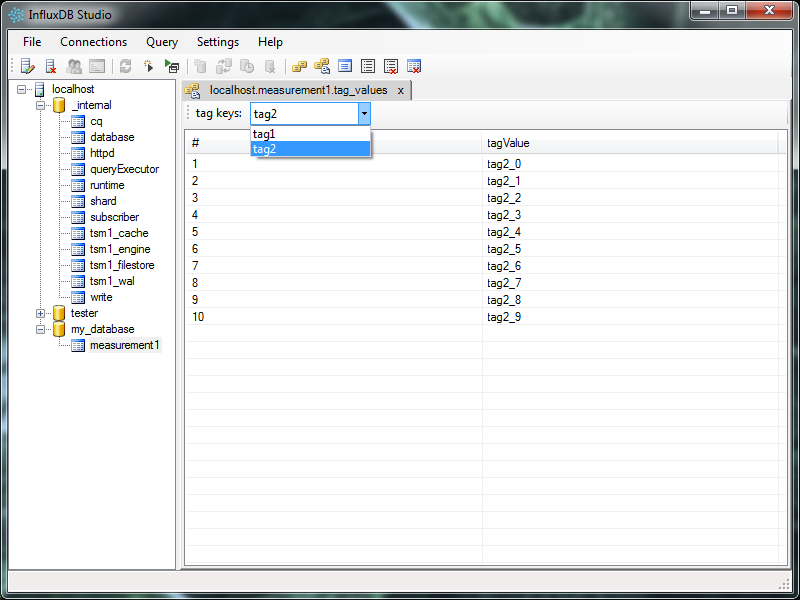
Select a measurement node in the tree view and either right-click or use the toolbar button and select Show Tag Values:
Use the drop down menu in the Tag Values tab to explore the values for each tag. Tag values can be exported by right-clicking in the results area and using the export context menu.
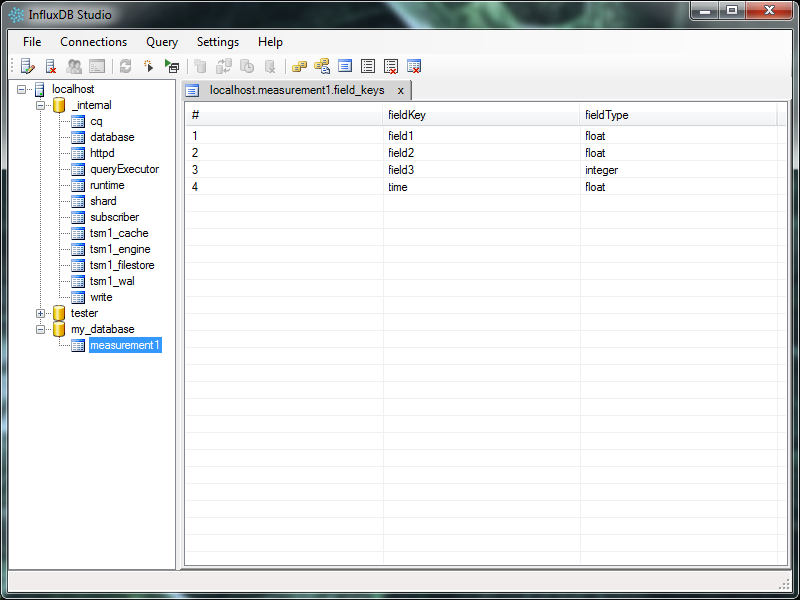
Select a measurement node in the tree view and either right-click or use the toolbar button and select Show Field Keys:
Field keys can be exported by right-clicking in the results area and using the export context menu.
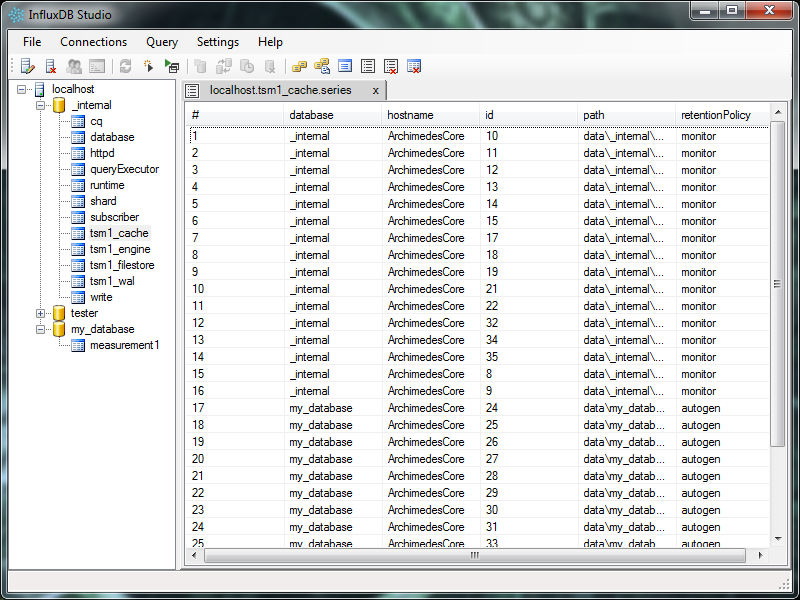
Select a measurement node in the tree view and either right-click or use the toolbar button and select Show Series:
Series information can be exported by right-clicking in the results area and using the export context menu.
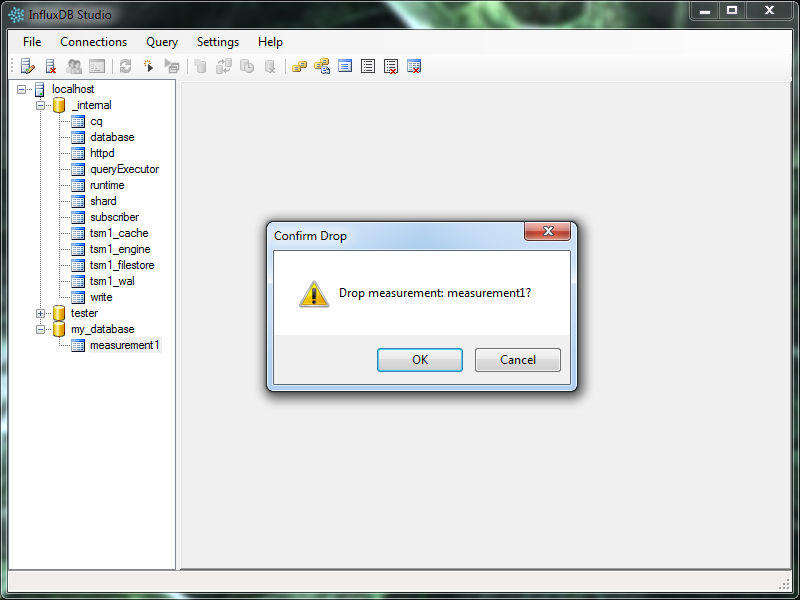
To drop a measurement, select it in the tree view on the left. Then right-click or use the toolbar button and select Drop Measurement:
Confirm that you would like to drop the selected measurement (this is a permanent operation).
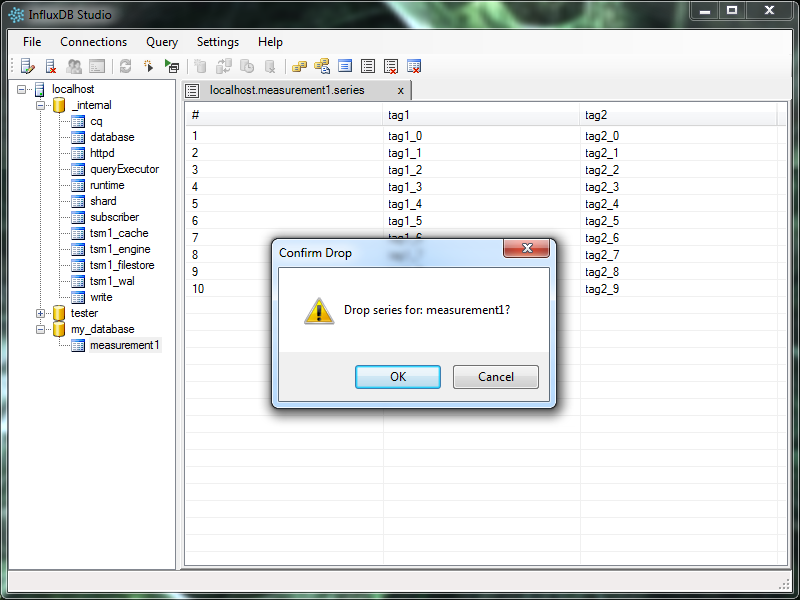
To drop all series for a measurement, select the measurement in the tree view on the left. Then right-click or use the toolbar button and select Drop Series:
Confirm that you would like to drop series for the selected measurement (this is a permanent operation). The measurement will be left intact, but all series data will be dropped.
The following is a list of available commands when working with users and privileges:
- Create User - Creates a new user on the InfluxDB server.
- Edit User - Allows a user's administrator status to be updated.
- Change Password - Allows a user's password to be updated.
- Drop User - Drops a user from the InfluxDB server.
- Grant Privilege - Grants a privilege (Read, Write, All) to a user for a particular database.
- Edit Privilege - Updates a user's privilege for a particular database.
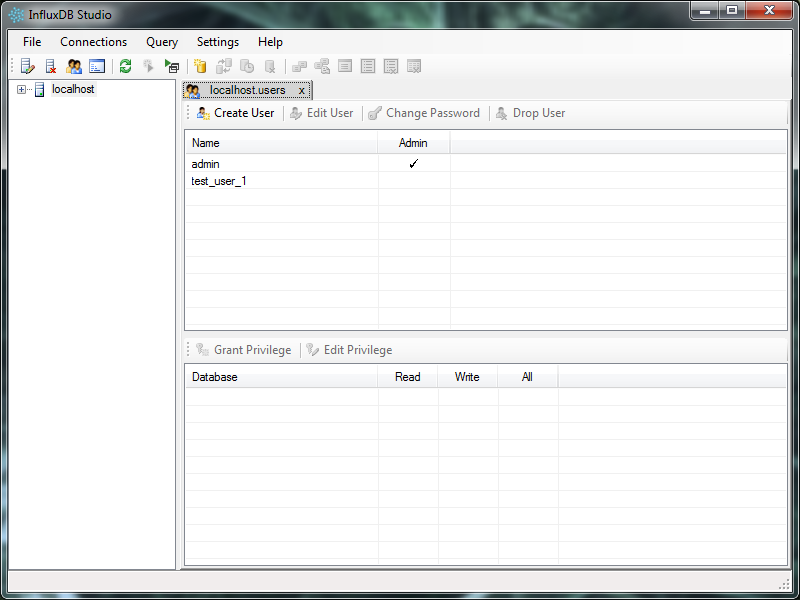
Select a connection node in the tree view and either right-click or use the toolbar button and select Show Users:
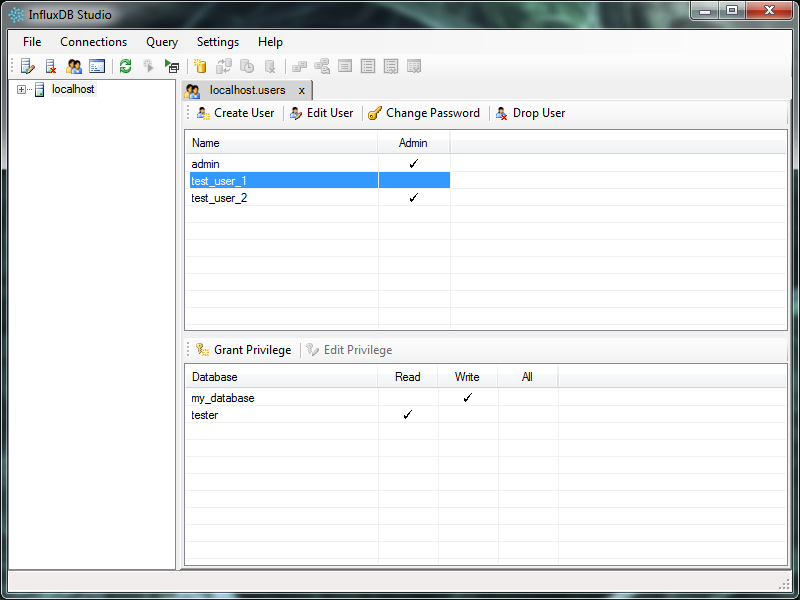
Users for the connection will be listed with an indicator of whether or not they have administrator privileges. Clicking on a user in the list will also let you browse and edit their database privileges.
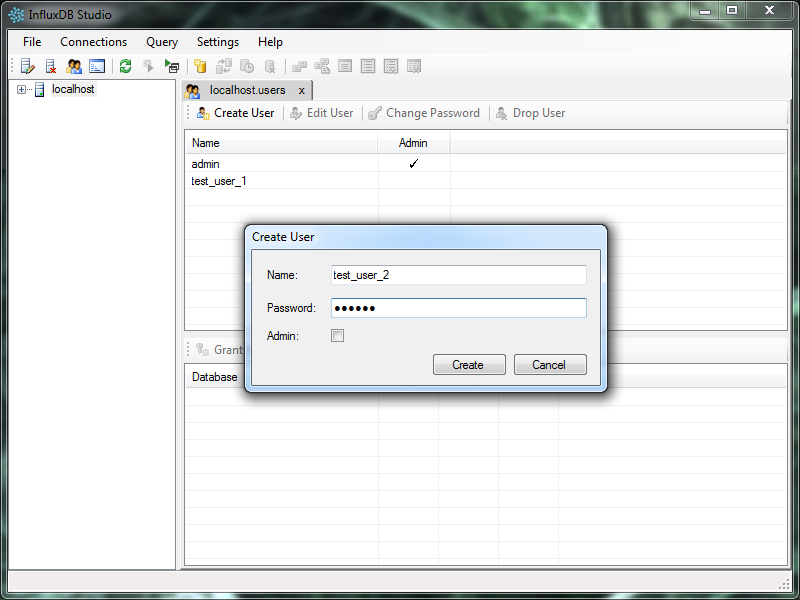
After bring up the Users tab by selecting the Show Users command, right-click or use the Create User button in the Users tab:
Enter the user's name and password and select whether or not they will be a server administrator and click the Create button.
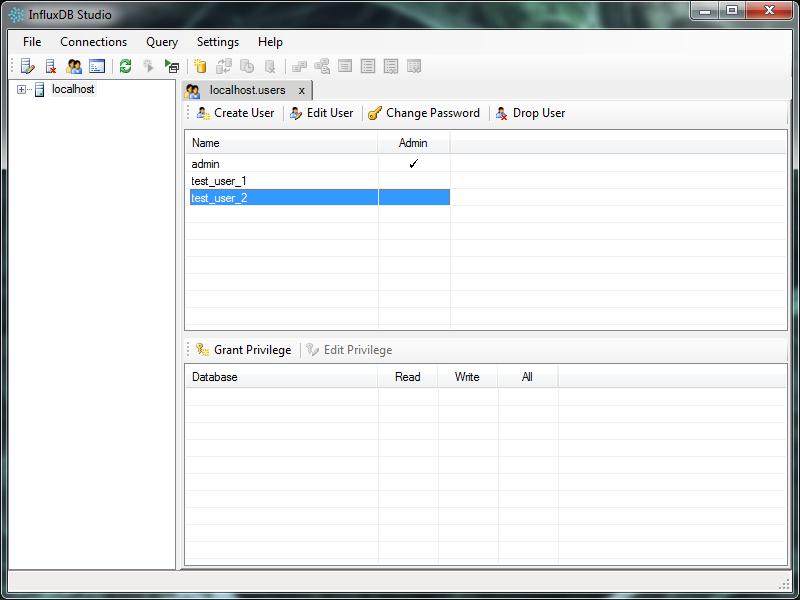
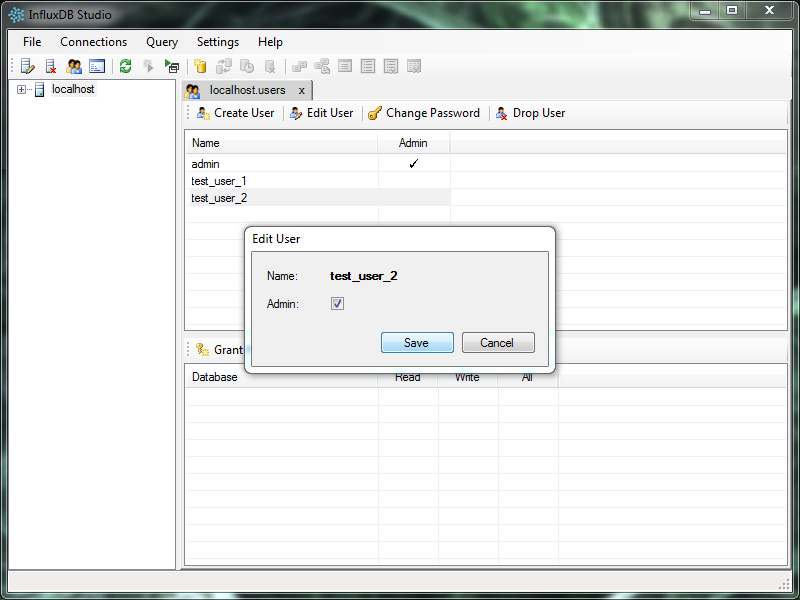
Presently the only editable aspect of a user is whether or not they are a server administrator. To edit a user right-click or click the Edit User button in the Users tab:
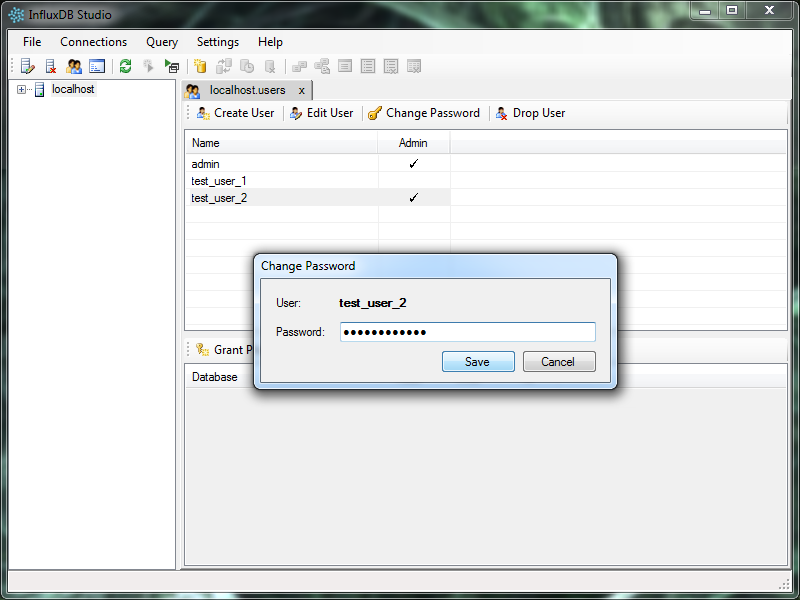
To update a user's password, right-click or click the Change Password button in the Users tab:
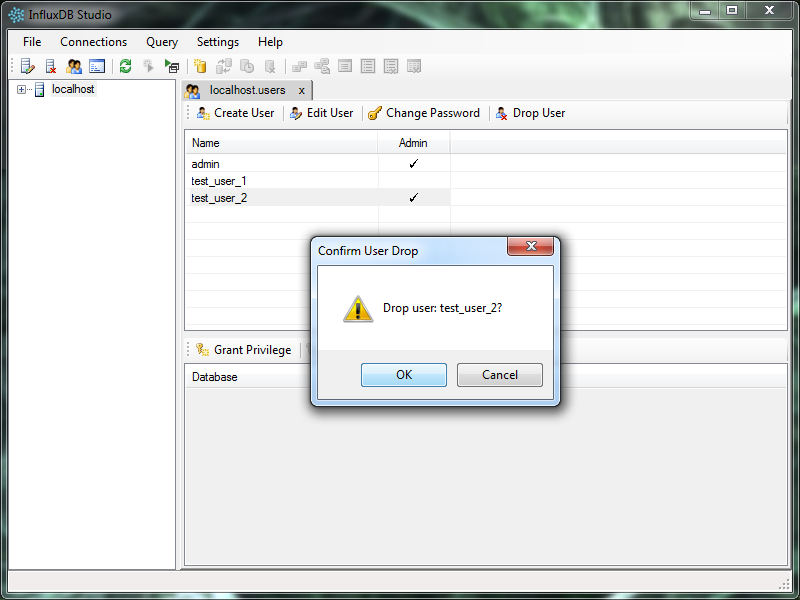
To drop a user, right-click or click the Drop User button in the Users tab:
Confirm that you would like to drop the selected user (this is a permanent operation).
After bring up the Users tab by selecting the Show Users command, click on a user to select them from the list. The user's various databases privileges will be listed in the Privileges Panel below the users list.
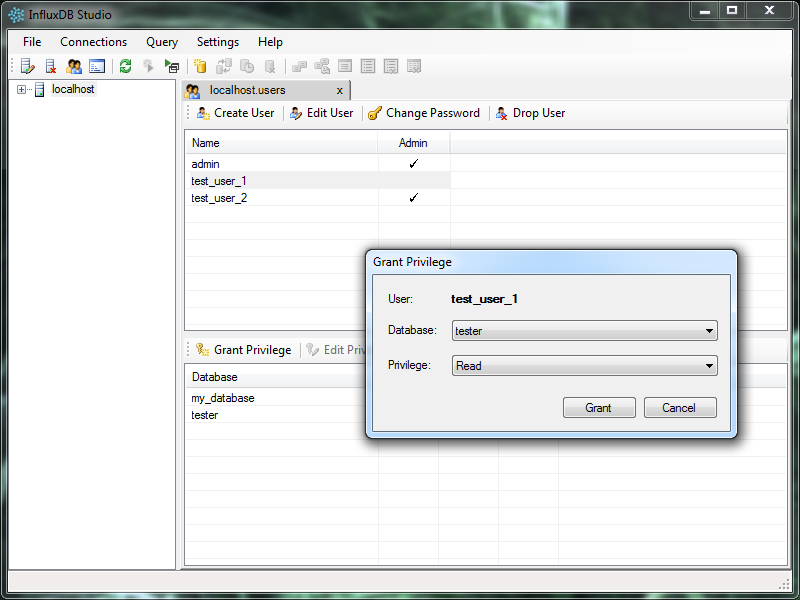
To grant a new database privilege to a user make sure the user is selected in the users list and then right-click in the Privileges Panel or click the Grant Privilege button:
Select the database the privilege will be for and then select one of the following privileges to grant:
- Read - The user can only read from the database.
- Write - The user can only write to the database.
- All - The user can read and write to the database.
Click the Grant button to grant the user the privilege:
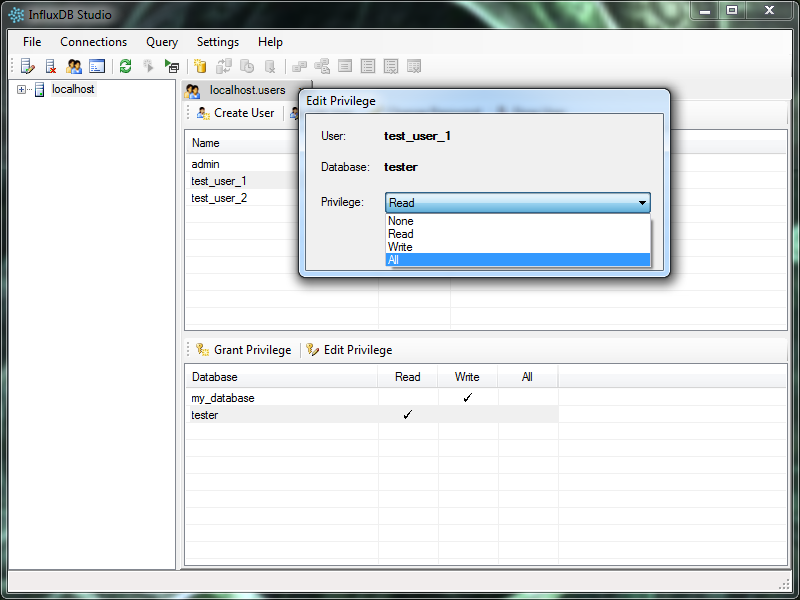
To edit a privilege make sure the user is selected in the users list and then right-click in the Privileges Panel or click the Edit Privilege button:
Select the desired privilege from the drop down and save. To revoke all privileges, select the None option.
Application settings can be adjusted in the application Settings menu. Settings and connection information can also be imported and exported.
- Settings → Time Format
- 12 hour - Time will be displayed in a 12 hour format with AM/PM.
- 24 hour - Time will be displayed in a 24 hour format.
- Settings → Date Format
- Month First - Dates will be displayed as: mm/dd/yyyy.
- Day First - Dates will be displayed as: dd/mm/yyyy.
- Allow Untrusted SSL - When this setting is turned on, untrusted SSL certificates for InfluxDB servers will be allowed.
To export application settings, including all configured InfluxDB server connections, select File → Export → Settings from the application menu and choose a location and file name for the settings file and click Save.
To import application settings, including all configured InfluxDB server connections, select File → Import → Settings from the application menu and browse to and select the exported settings file you would like to import then click Open.
Code and documentation are available according to the MIT License (see LICENSE).
