Example repository showcasing the utilization of logging, monitoring and tracing solutions, communicating with them through backend services.
- Instrumenting a go application for prometheus
- Prometheus FastAPI Instrumentator
- Github repository for actix-web-prom
- Github repository for loki
- Official rust docker images with build and serve stages
- Install Loki with Docker or Docker Compose
- Send log data to Loki considering third-party clients for C#, Go, Python and more
- Grafana Loki HTTP API
- loki-logger Rust crate
- Serilog-Sinks-Loki Github repository
- Go promtail-client example
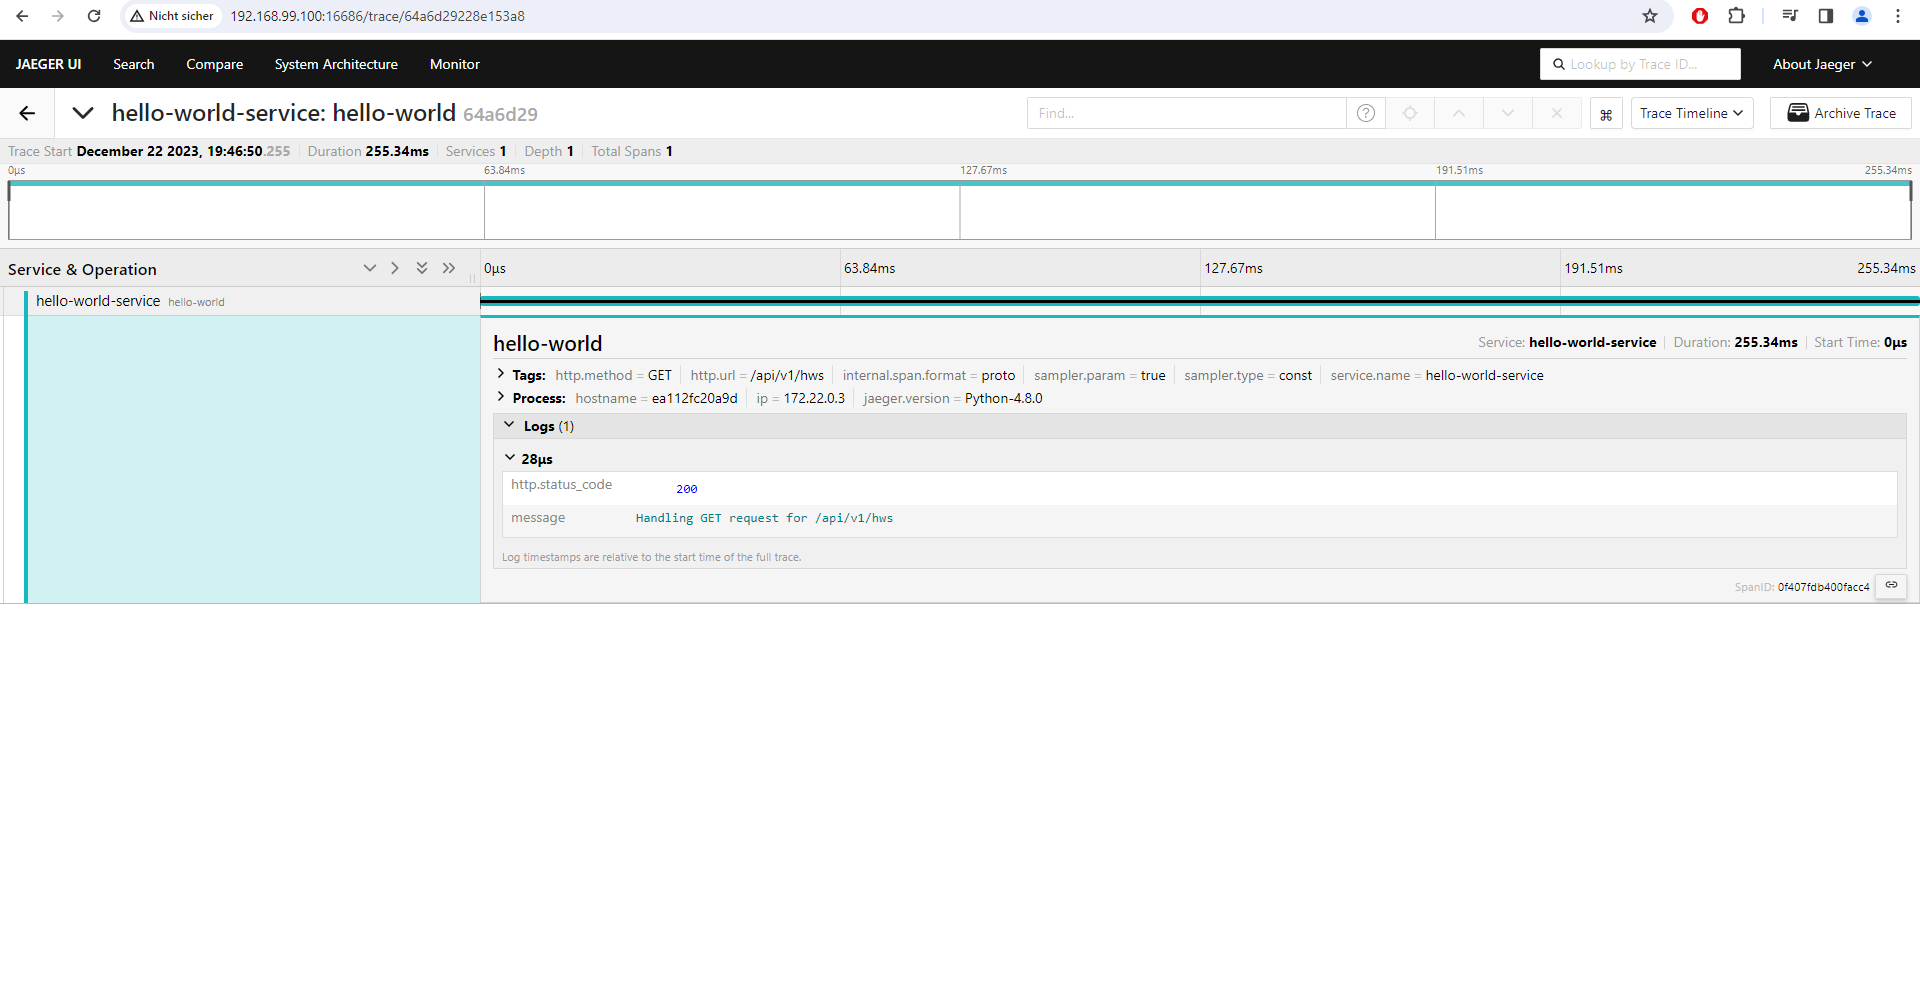
- Get up and running with Jaeger in your local environment
- Install the Docker Engine
Build and run the docker-compose network:
docker compose -f docker-compose.prometheus-grafana-stack.yml up -d --build # or `docker compose up -d --build`
# Because the build times for individual services (especially for Rust) are relatively lengthy, you may also opt to build and execute specific services.
docker compose -f docker-compose.prometheus-grafana-stack.yml up -d --build <service 1> <service 2> <service N>
# e.g.
docker compose -f docker-compose.prometheus-grafana-stack.yml up -d --build python-hello-world-service grafana prometheus
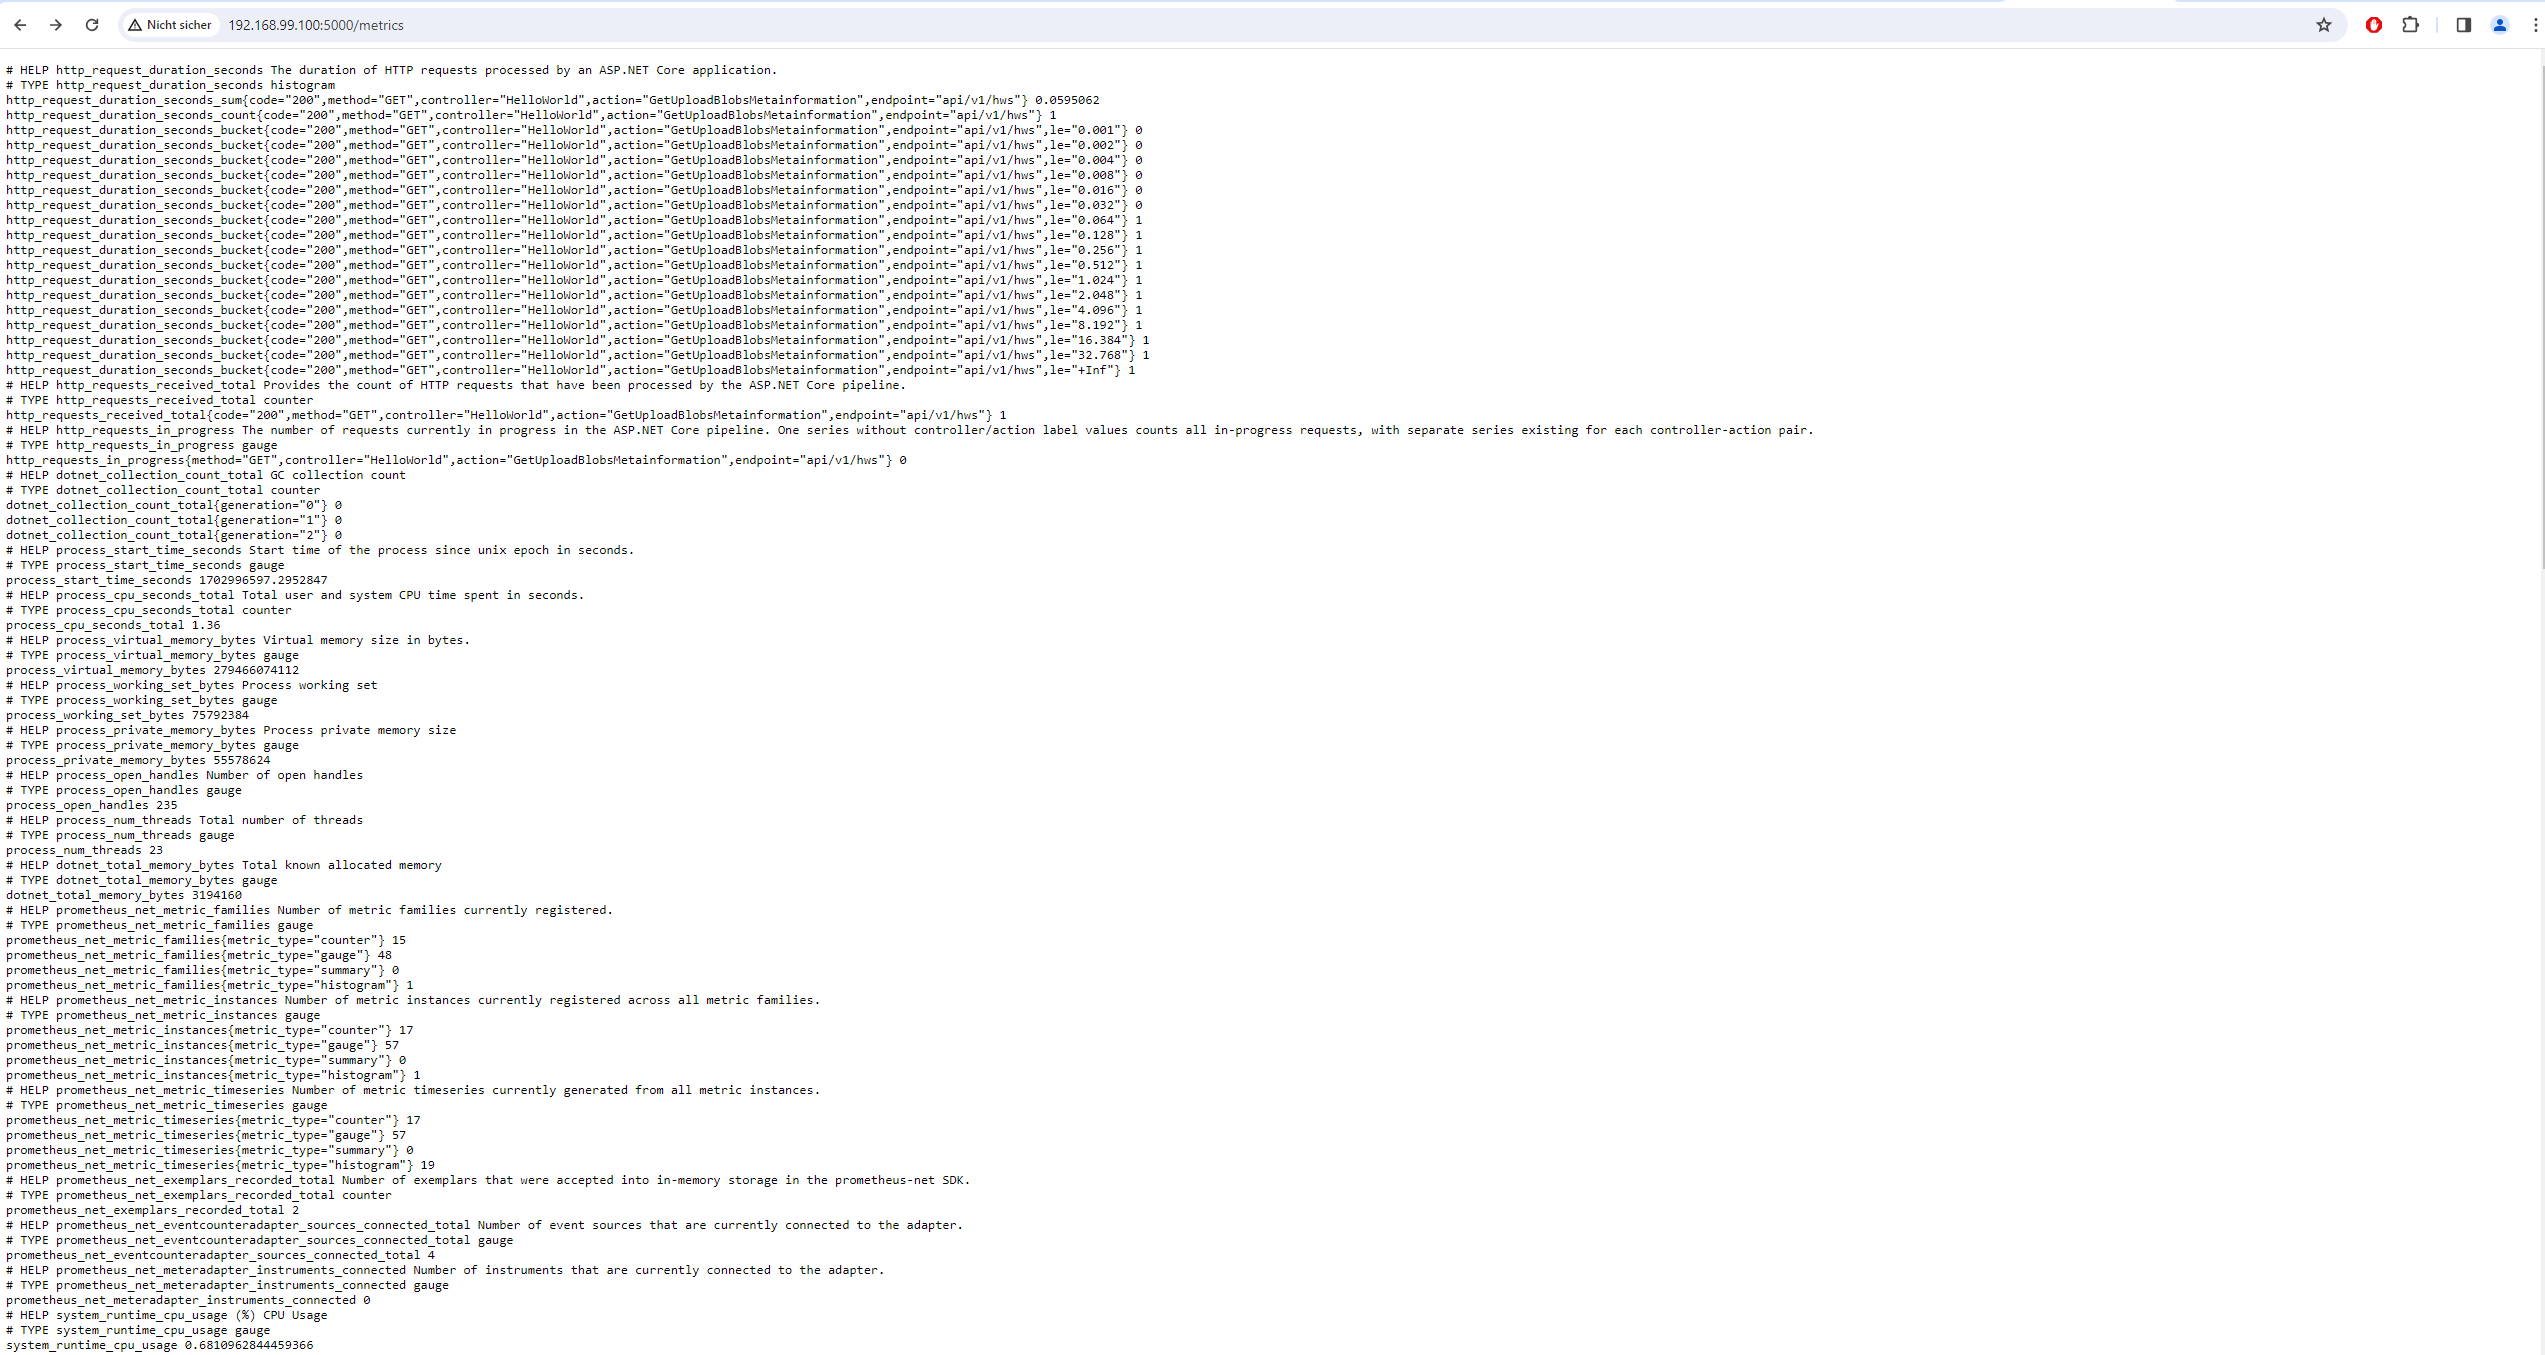
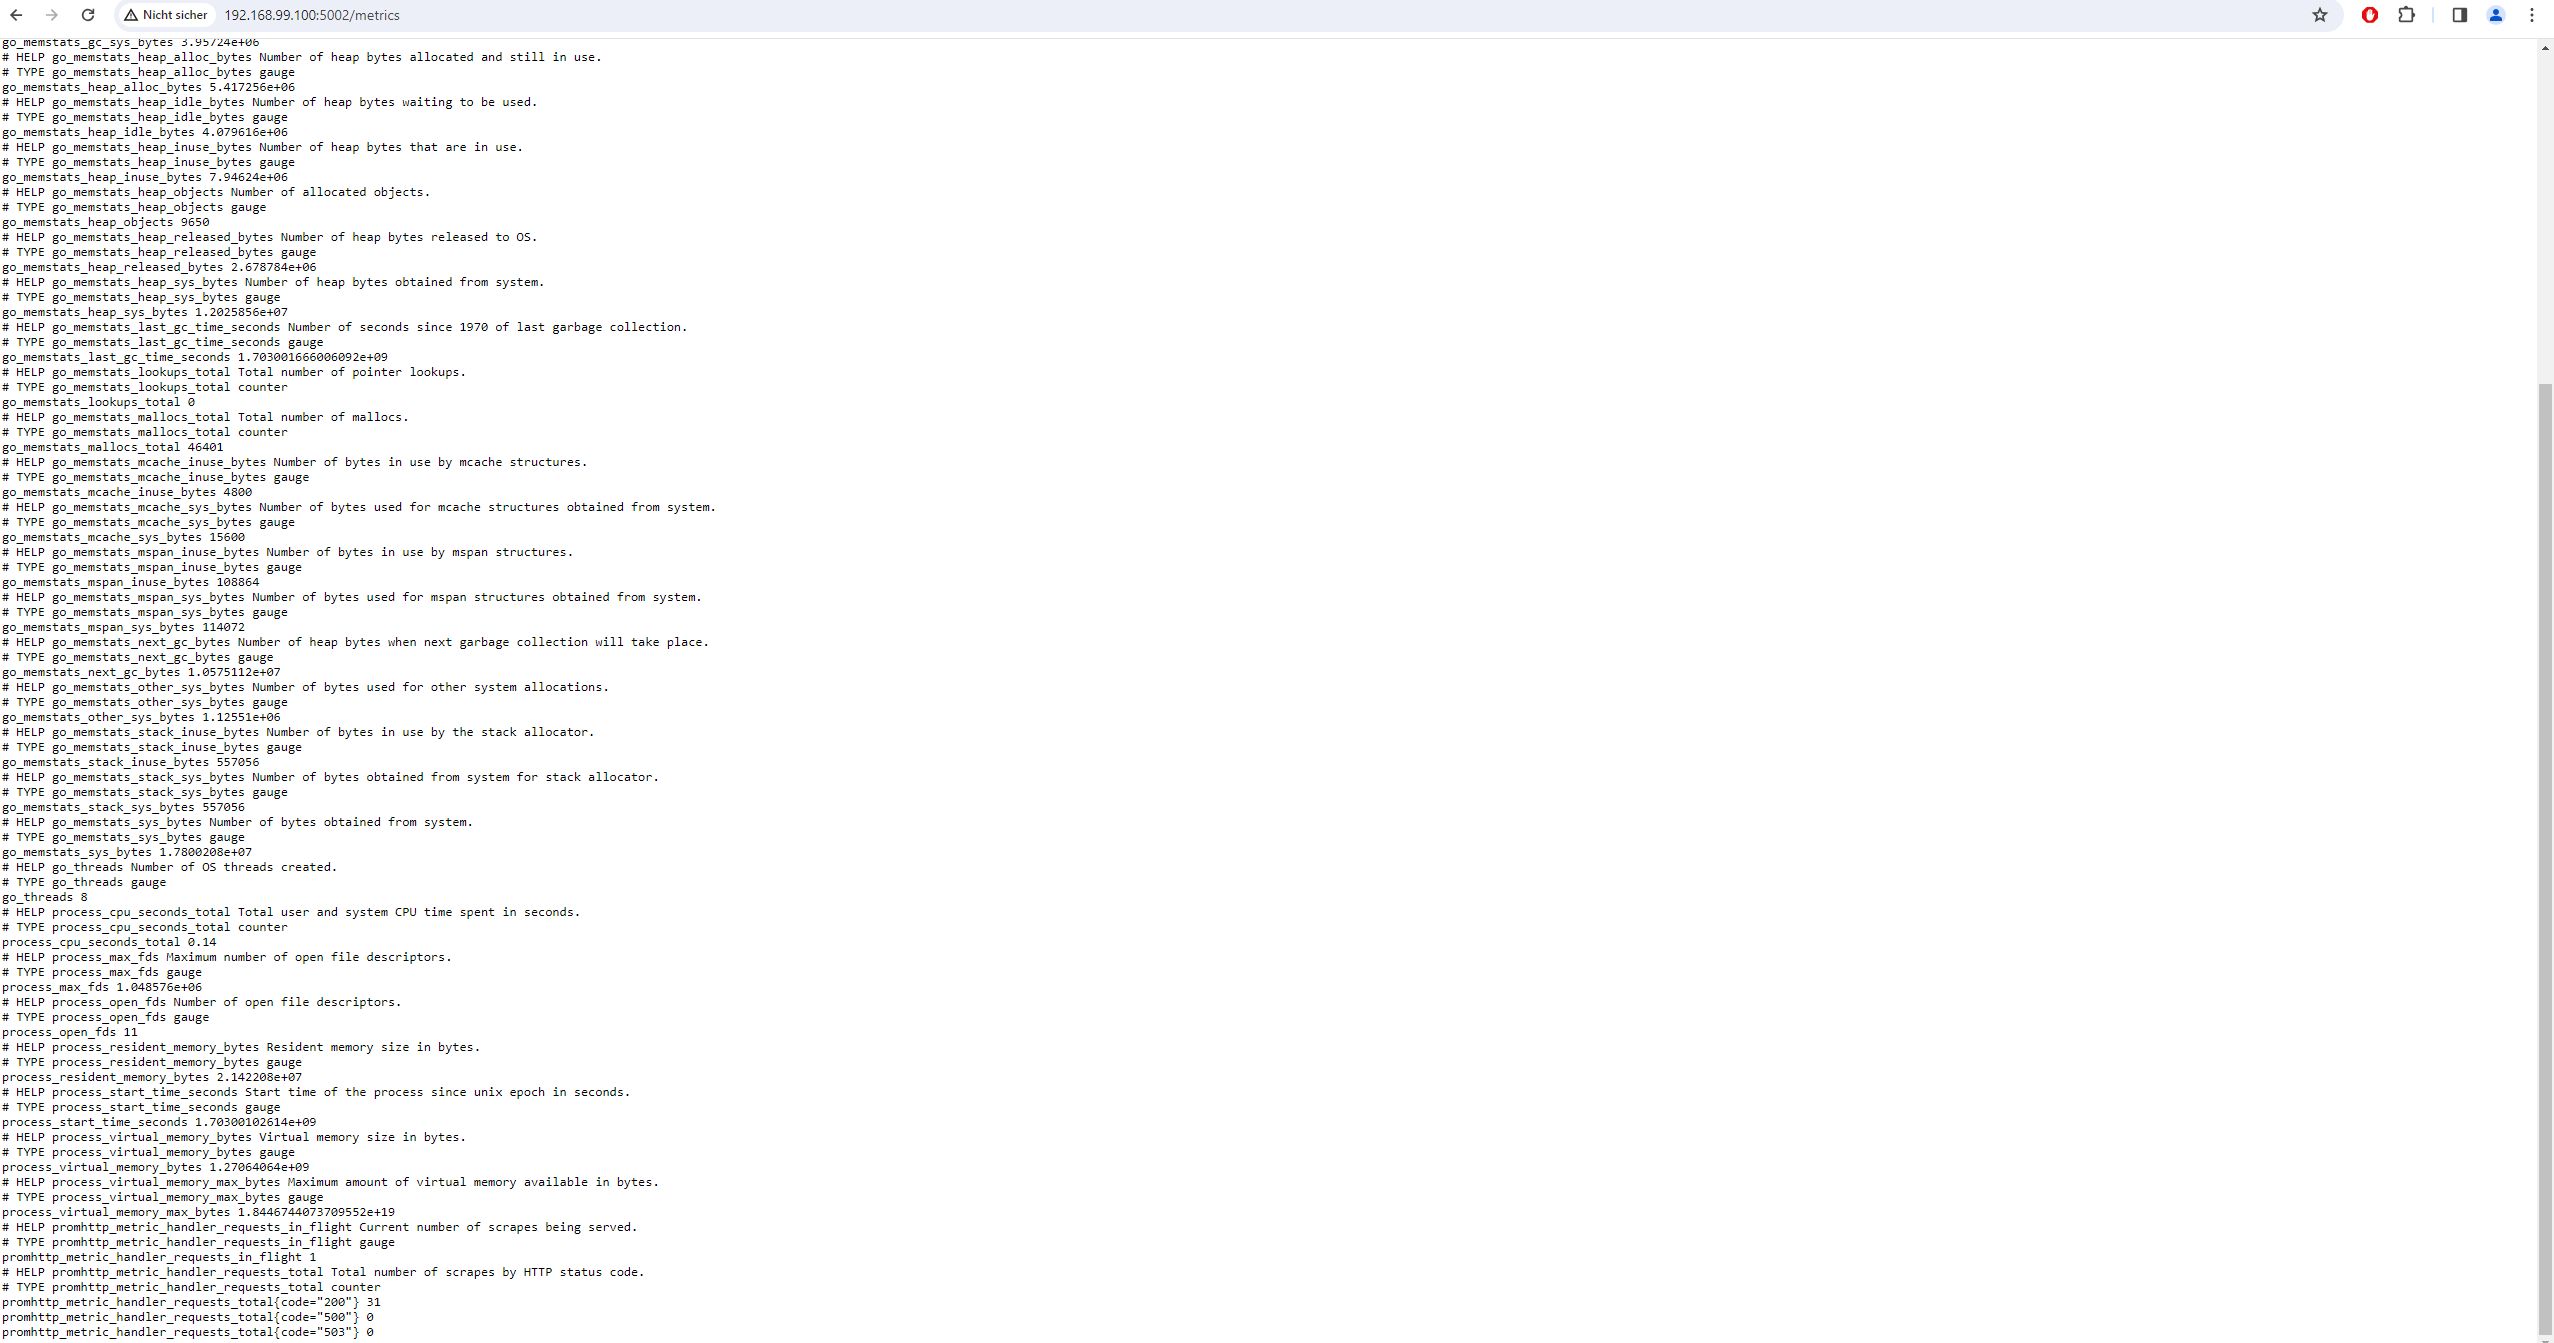
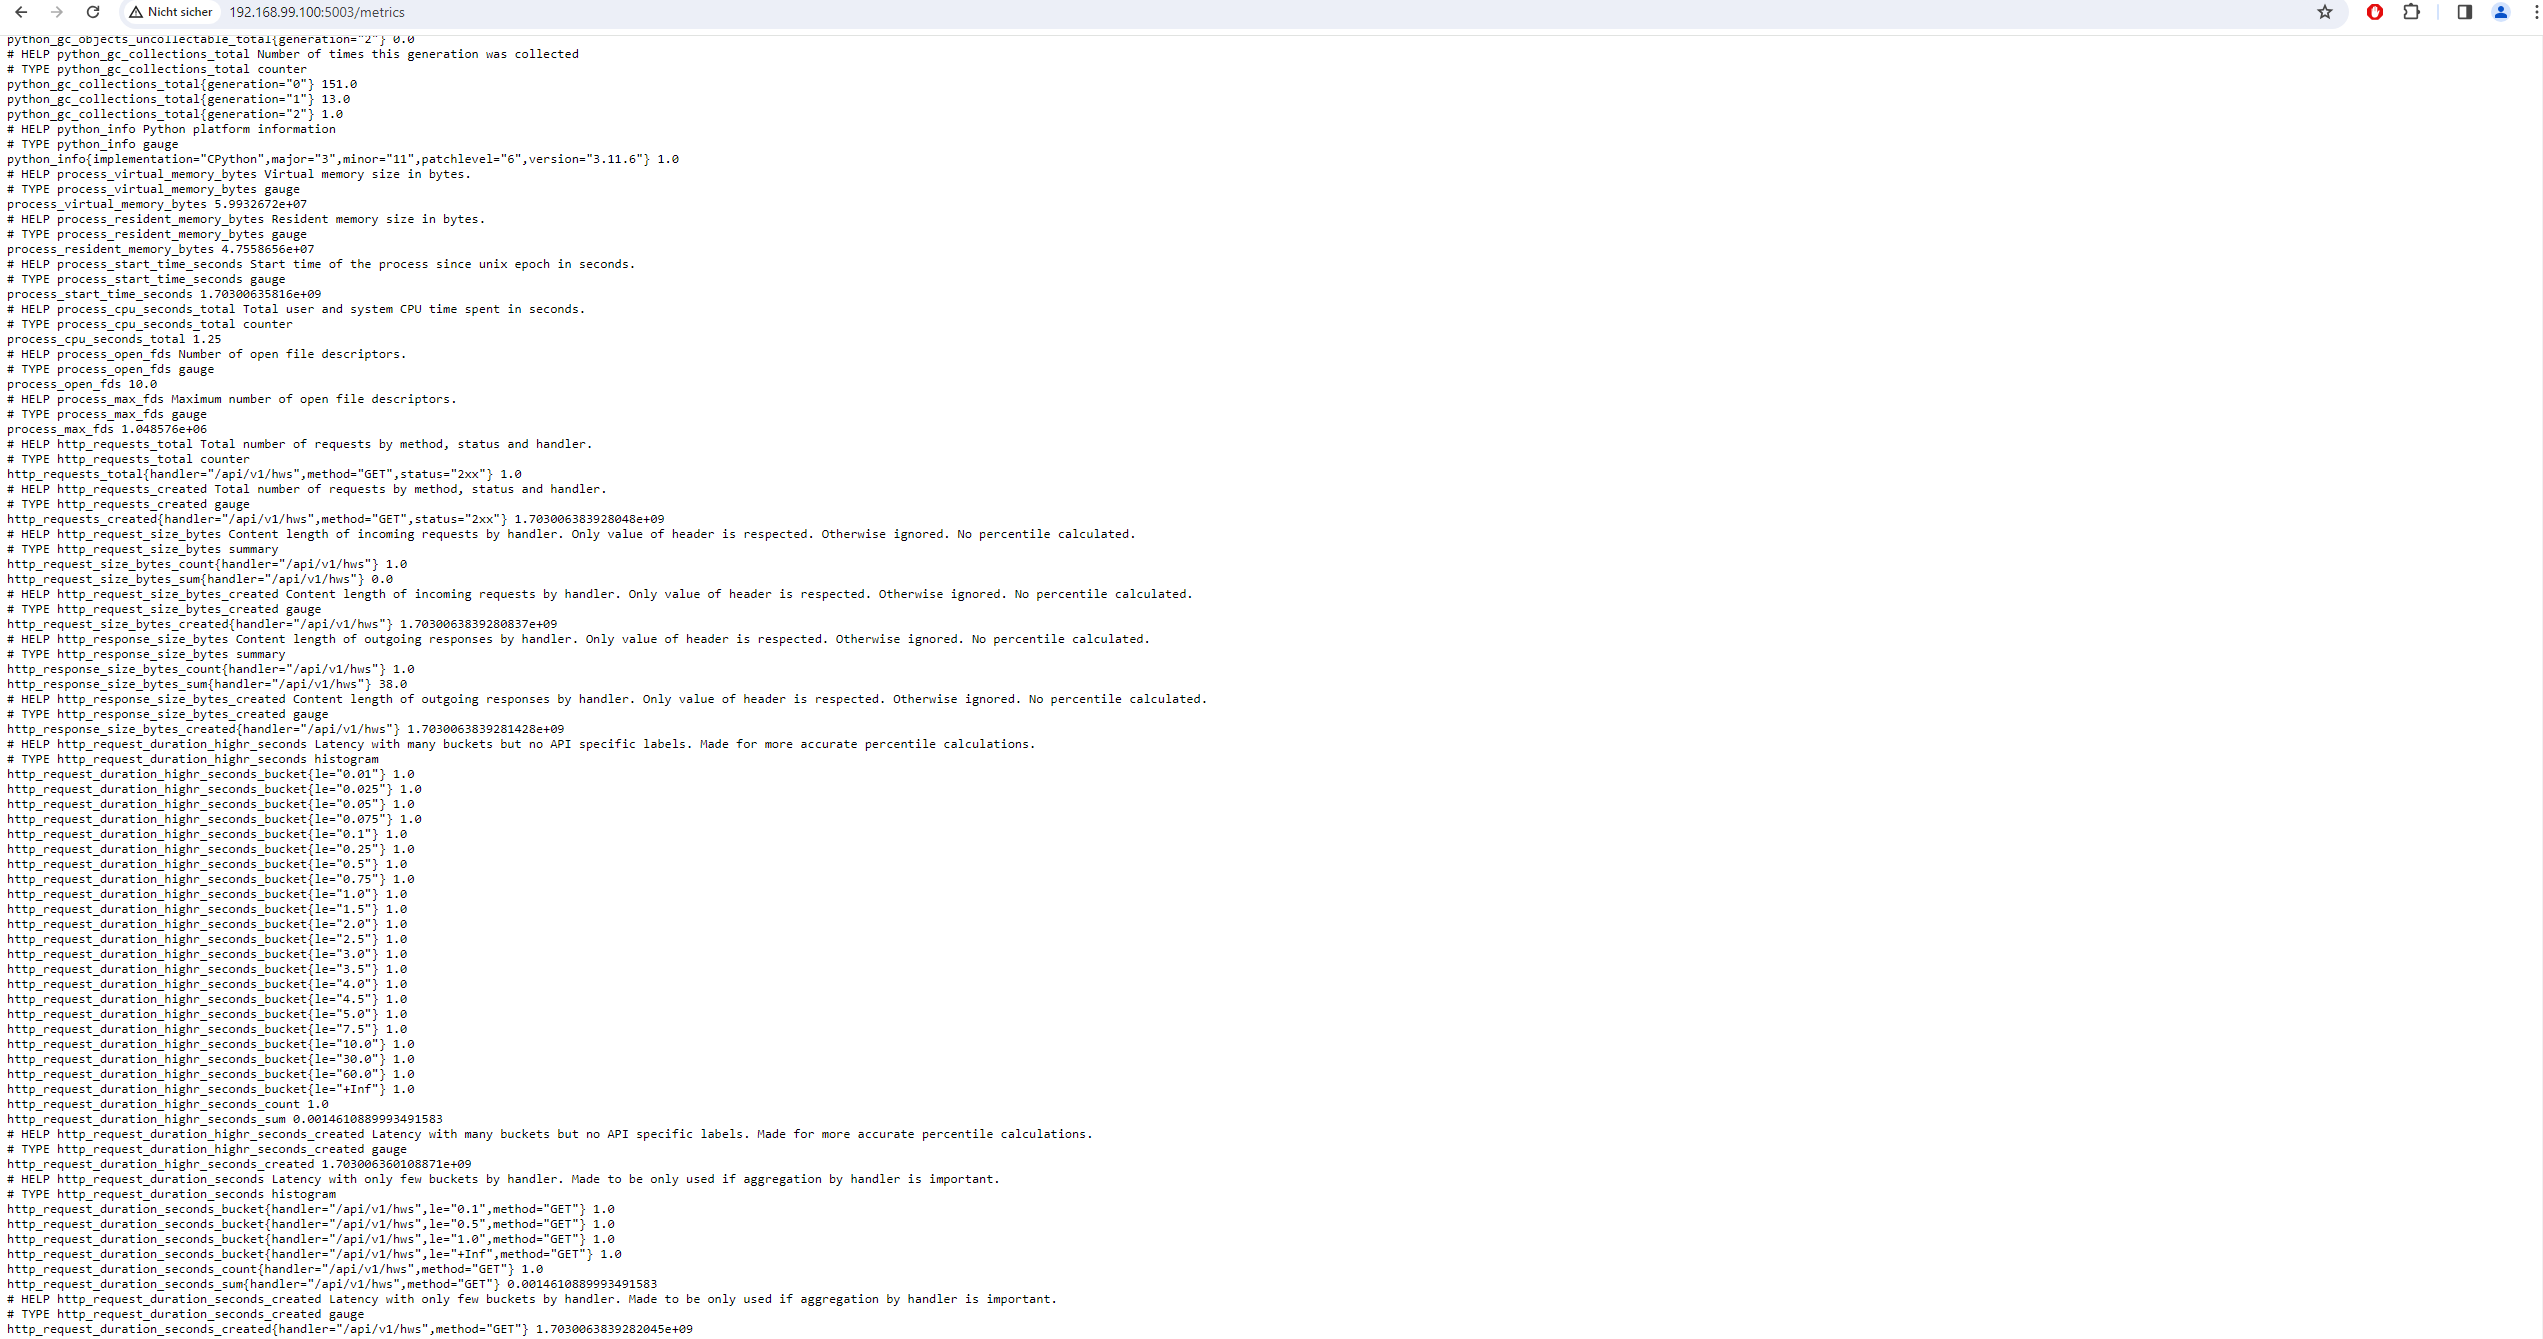
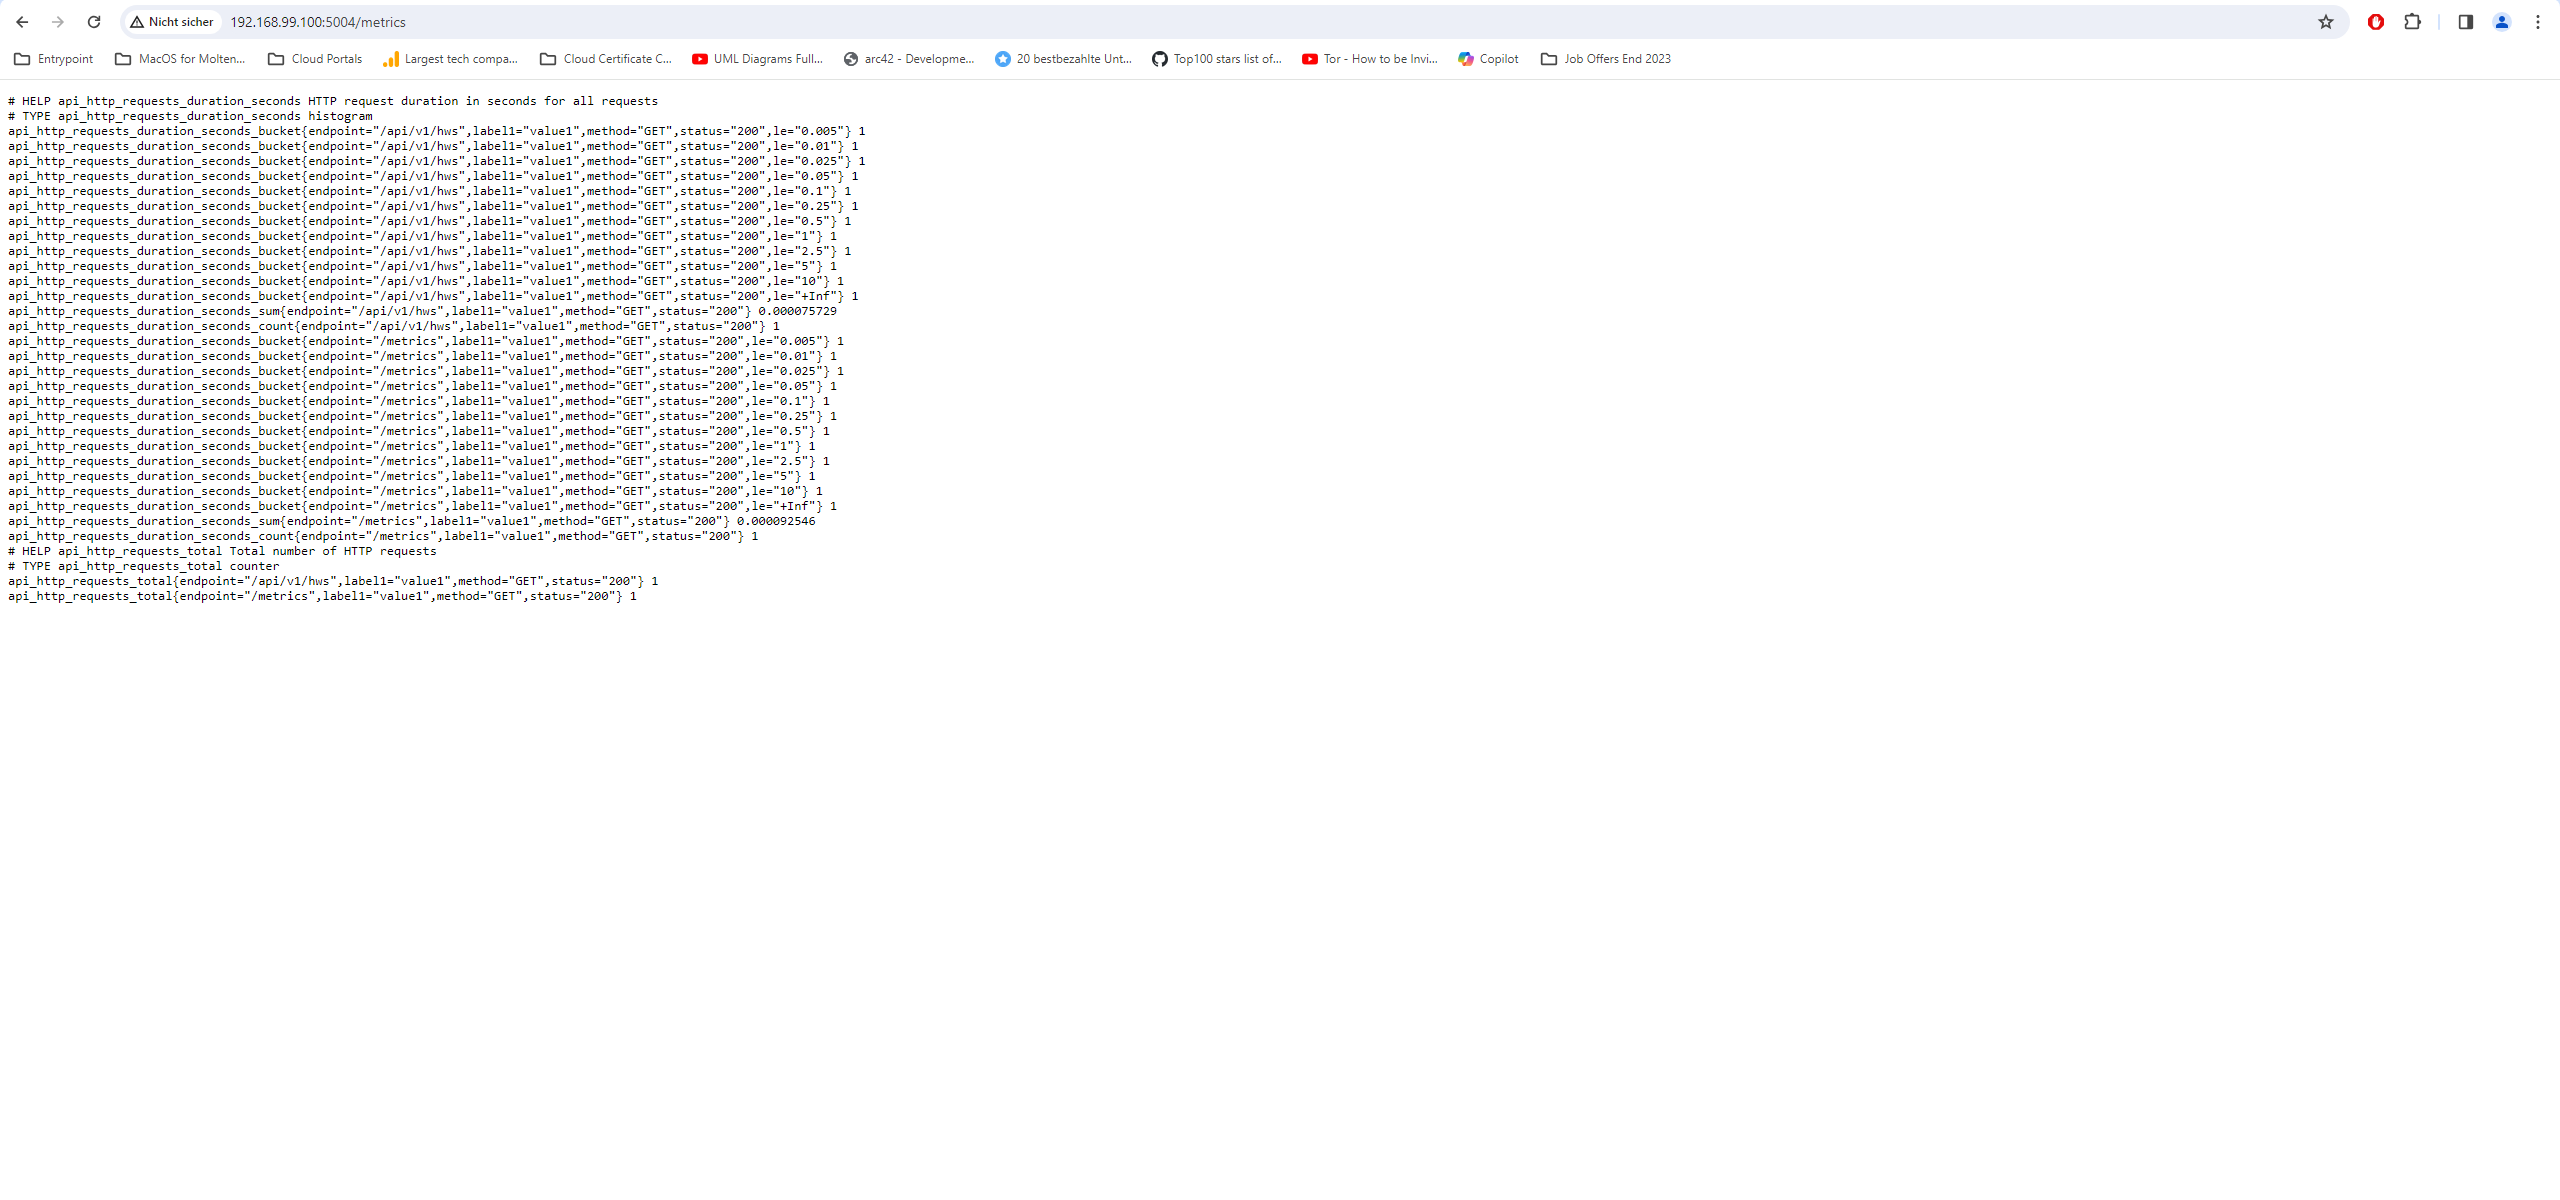
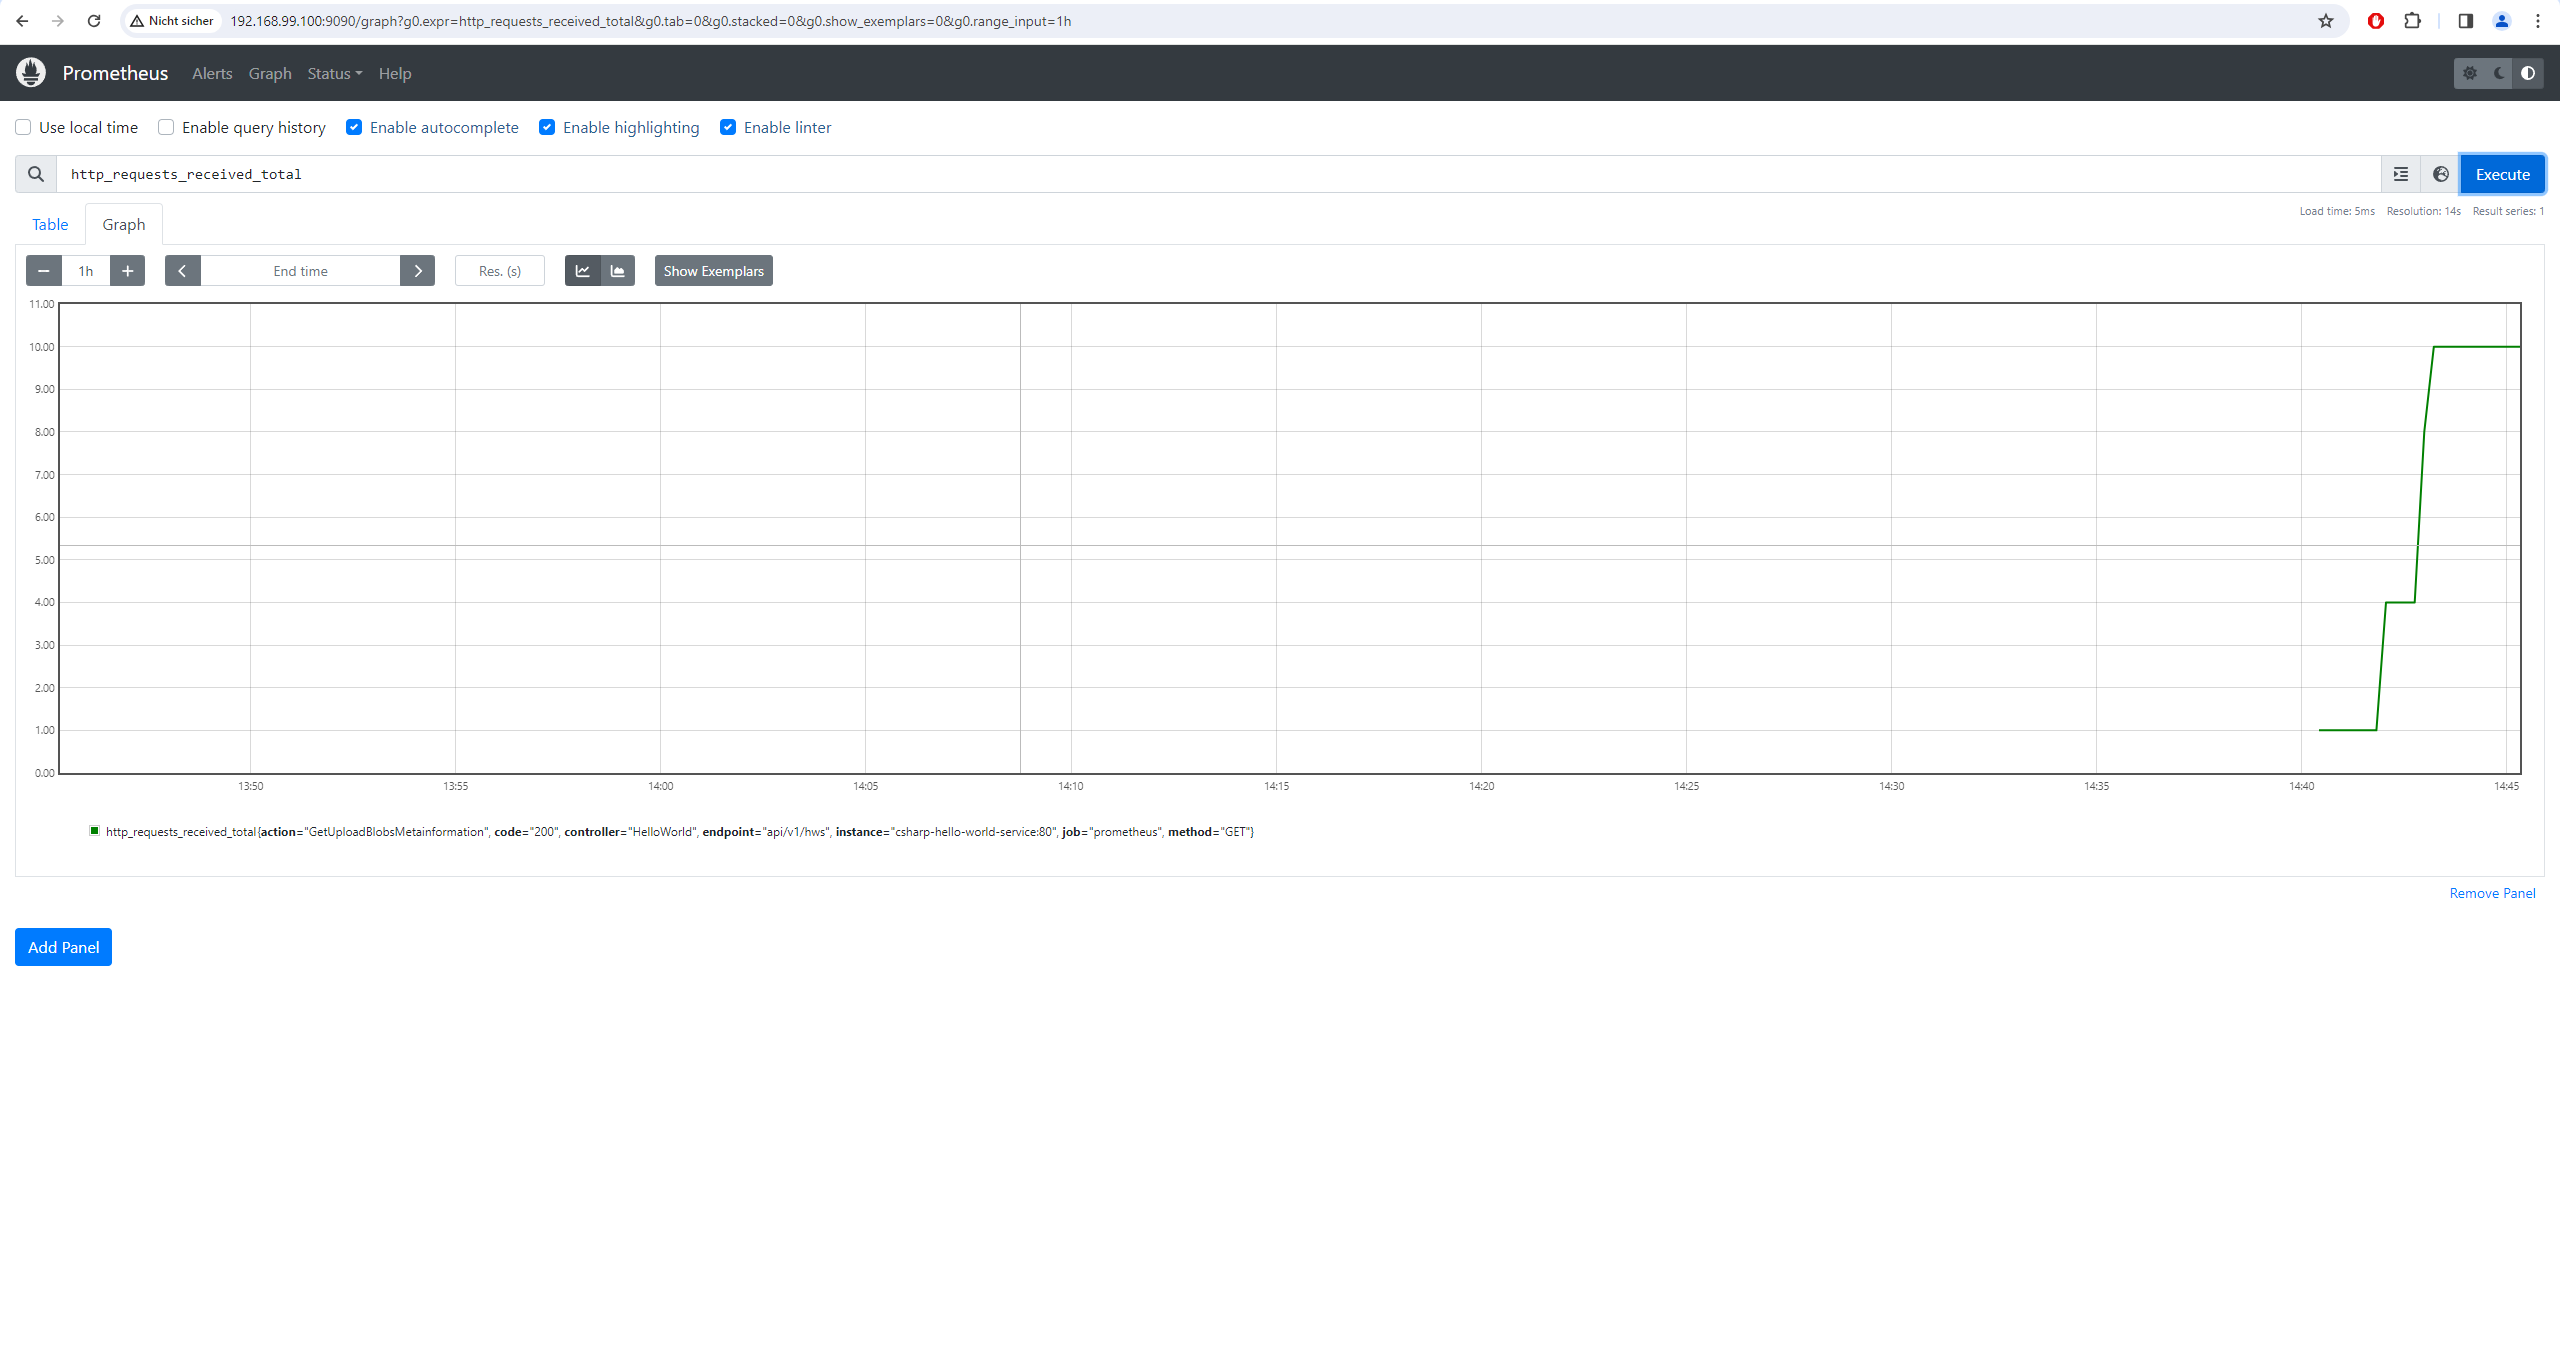
Access the Prometheus UI by navigating to localhost:9090 using a web browser. Here, you can explore discovered services with a metrics endpoint.
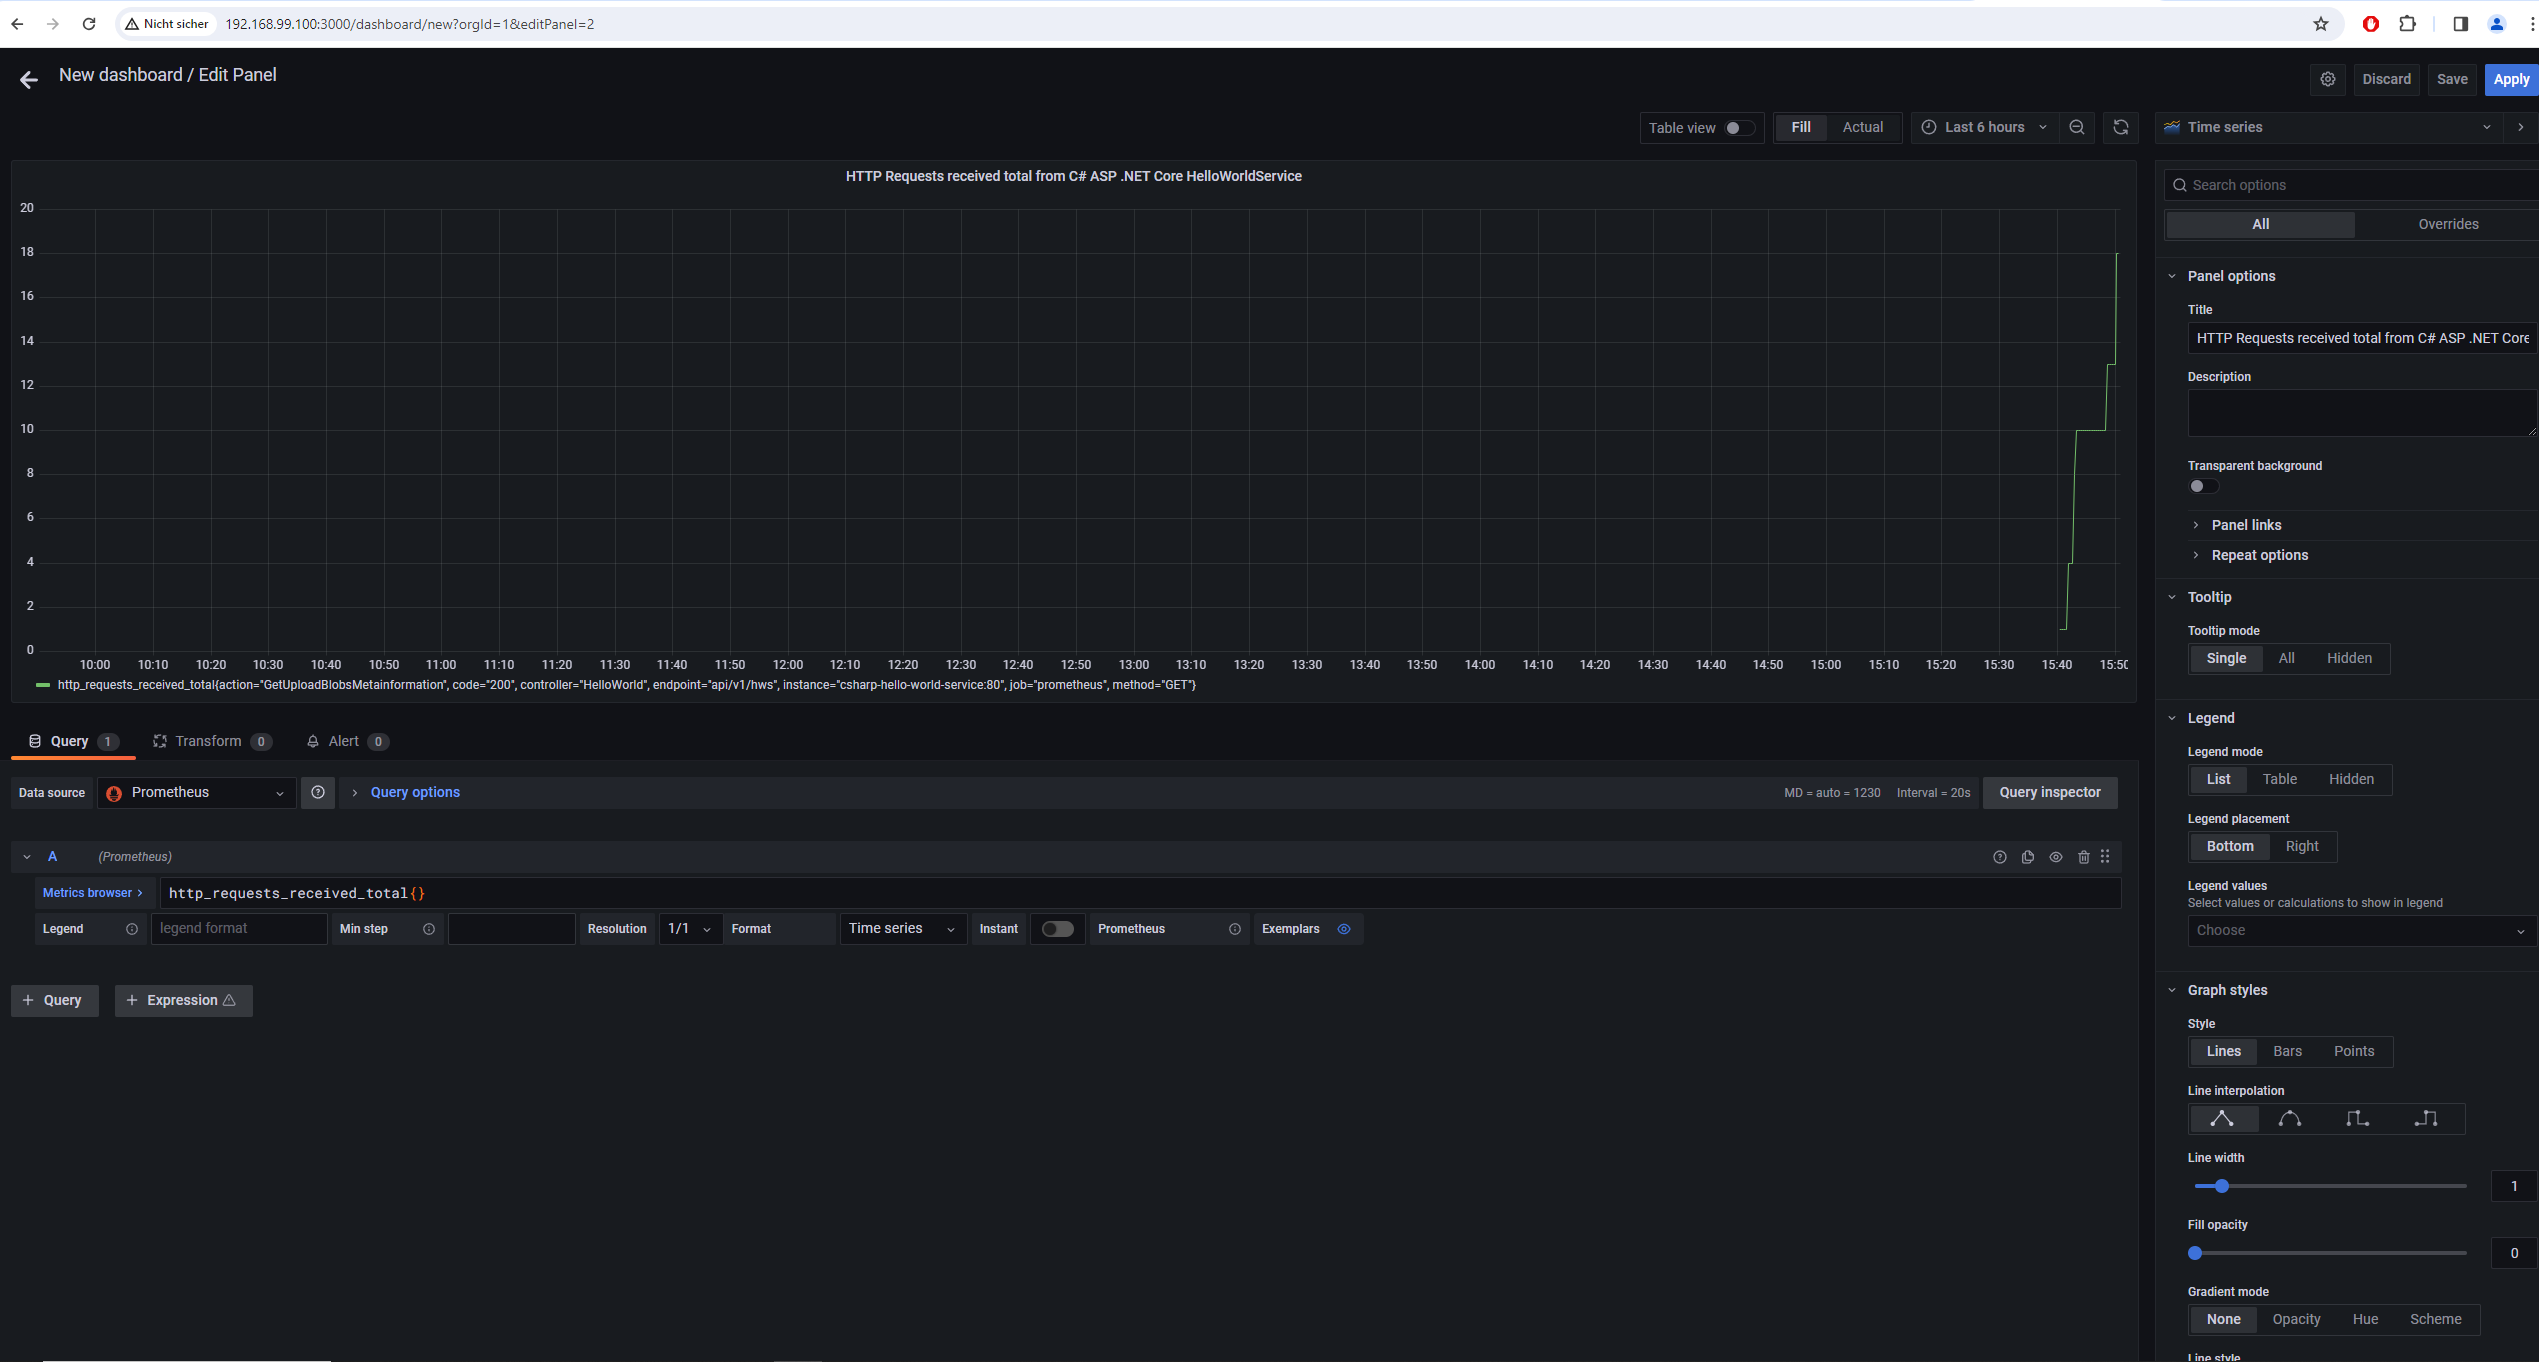
Access the Grafana UI by visiting localhost:3000 through a web browser. In this interface, you can create new dashboards.
Build and run the docker-compose network:
docker compose -f docker-compose.loki-grafana-stack.yml up -d --build # or `docker compose up -d --build`
# Because the build times for individual services (especially for Rust) are relatively lengthy, you may also opt to build and execute specific services.
docker compose -f docker-compose.loki-grafana-stack.yml up -d --build <service 1> <service 2> <service N>
# e.g.
docker compose -f docker-compose.loki-grafana-stack.yml up -d --build python-hello-world-service grafana lokiTo check Loki endpoints, run following curl commands:
curl -X GET http://localhost:3100/ready # You must ensure that the status changes from "Ingester not ready: waiting for 15s after being ready" to "ready". Else the communication to the Loki server will fail
curl -X GET http://localhost:3100/loki/api/v1/labels
curl -v -H "Content-Type: application/json" -XPOST -s "http://localhost:3100/loki/api/v1/push" --data-raw '{"streams": [{ "stream": { "foo": "bar2" }, "values": [ [ "1570818238000000000", "fizzbuzz" ] ] }]}'
curl -X GET http://localhost:3100/loki/api/v1/label/foo/values
You can also refer to the sample_loki_script.py which can be executed once a Loki docker instance is runnning. E.g.
# Install pip dependencies
pip install -r requirements.txt

python ./sample_loki_script.py --loki-url localhost:3100

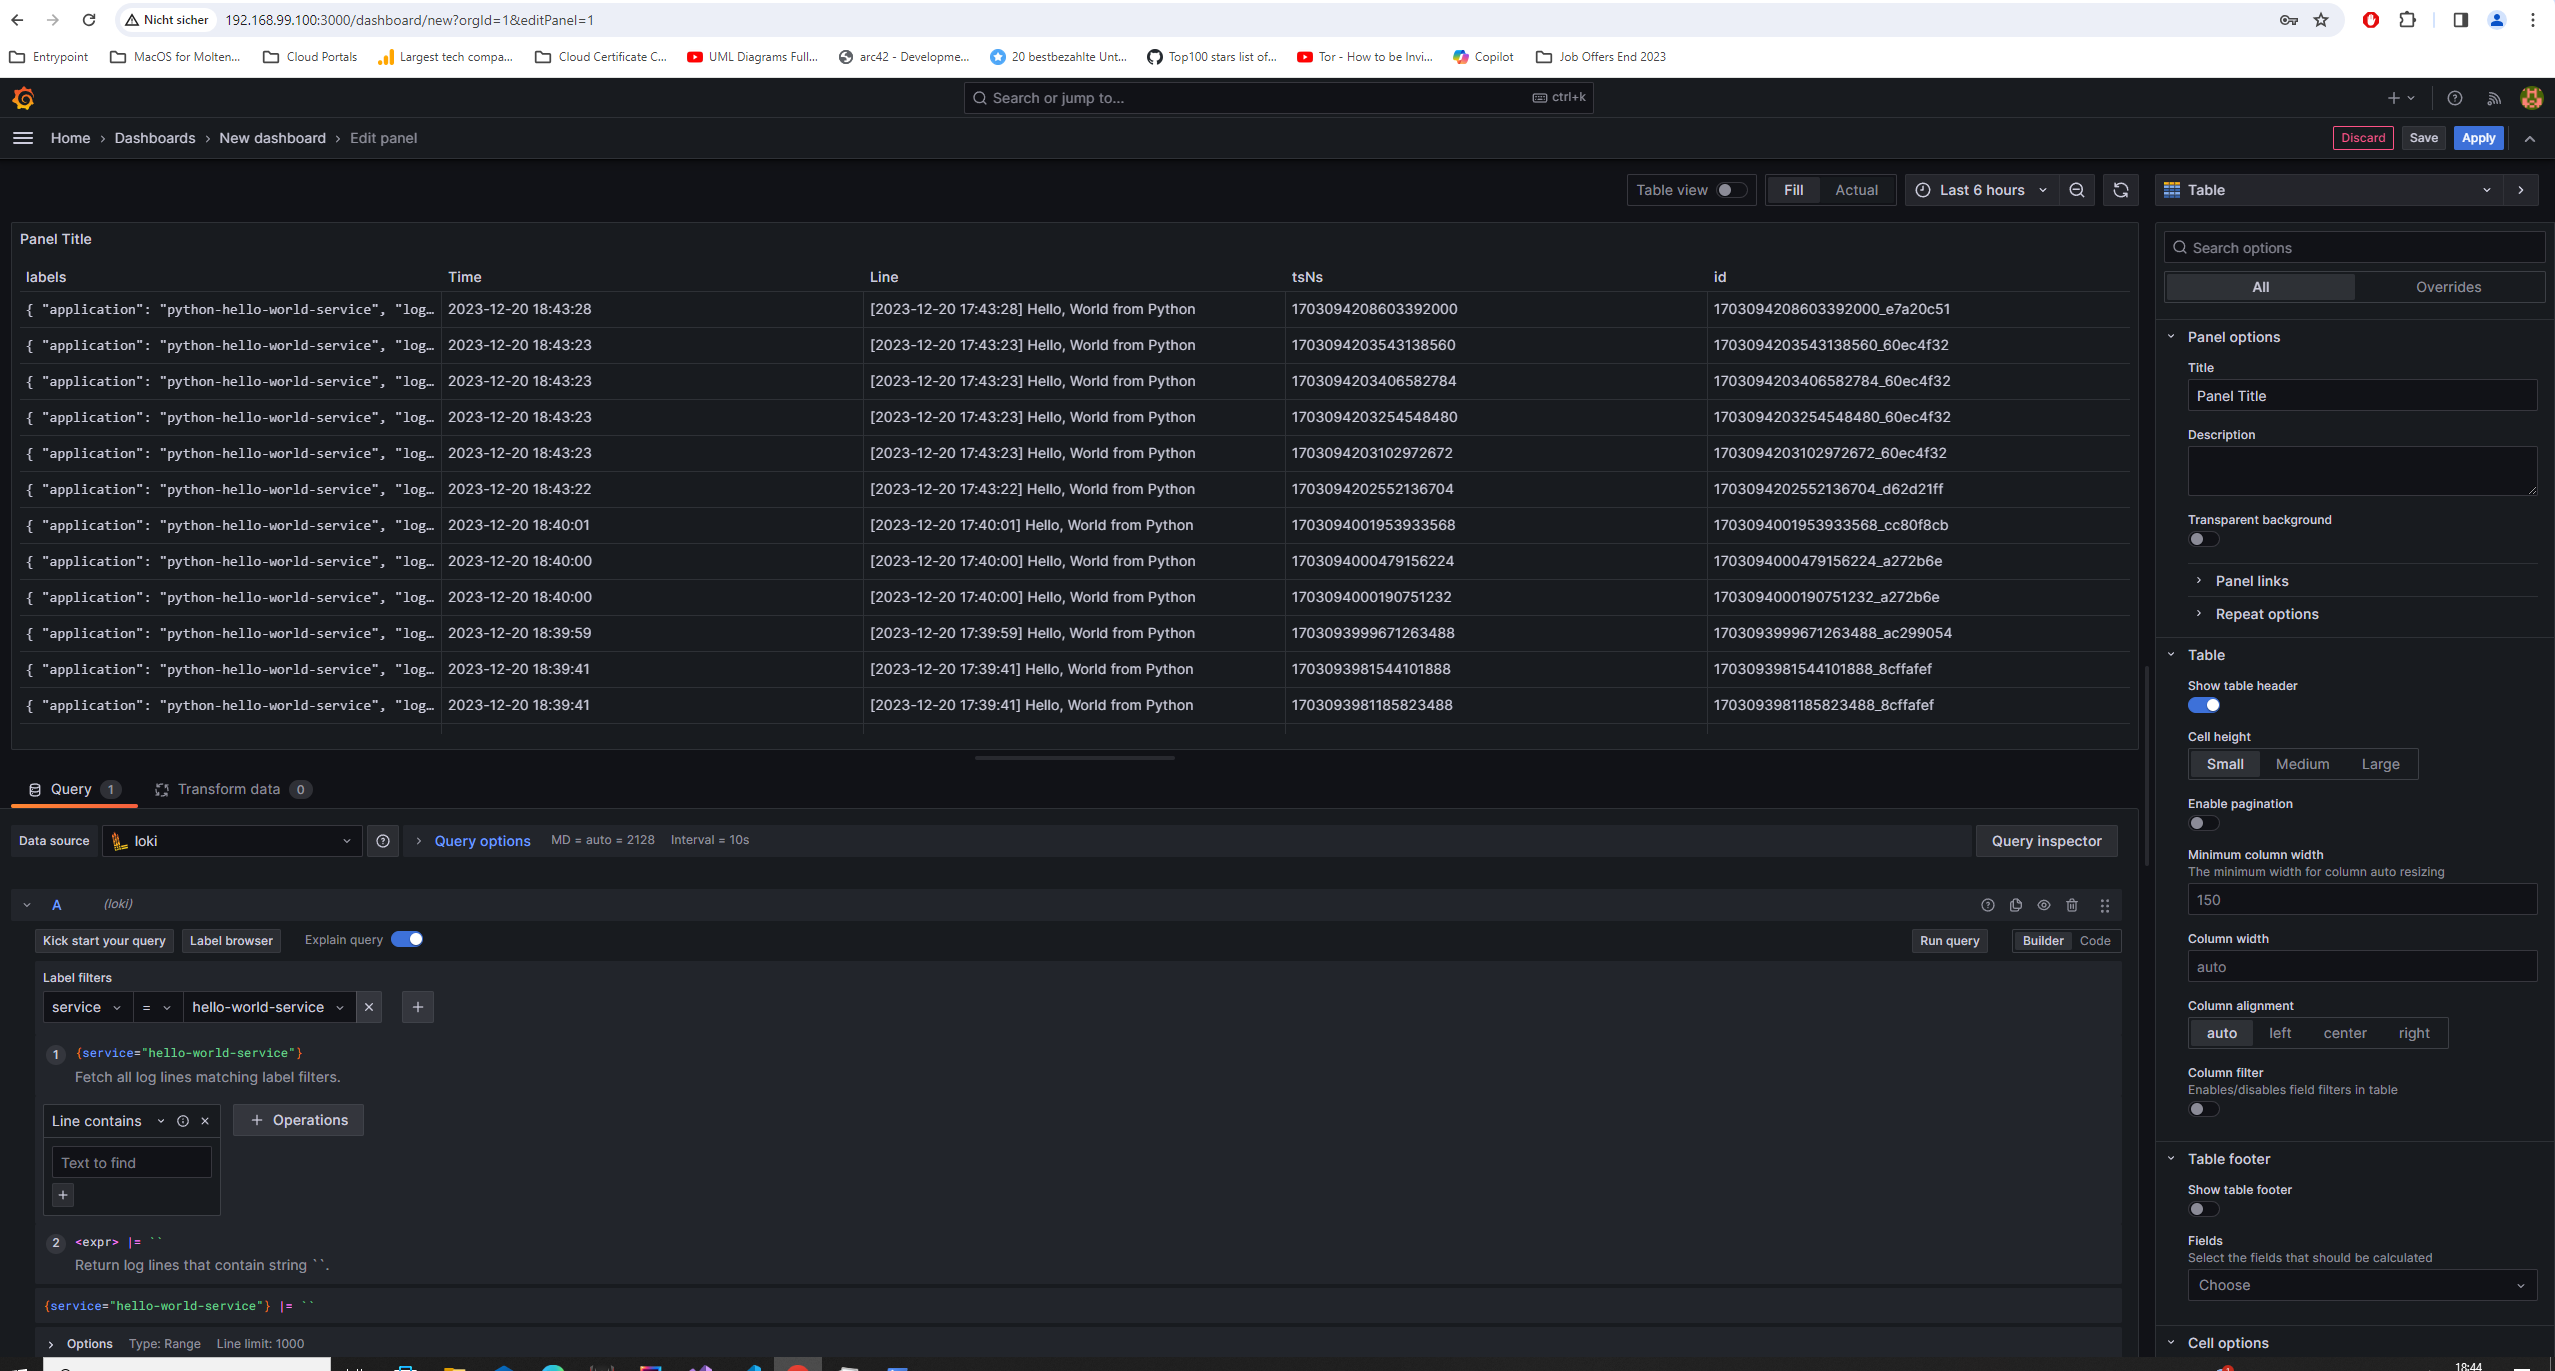
# You can expect to receive a status code of 204. Access the Grafana service running within the Docker Compose cluster by navigating to 192.168.99.100:3000 using a web browser. From there, you'll be able to create a dashboard, utilizing the Loki datasource.Build and run the docker-compose network:
docker compose -f docker-compose.jaeger.yml up -d --build # or `docker compose up -d --build`
# Because the build times for individual services (especially for Rust) are relatively lengthy, you may also opt to build and execute specific services.
docker compose -f docker-compose.jaeger.yml up -d --build <service 1> <service 2> <service N>
# e.g.
docker compose -f docker-compose.jaeger.yml up -d --build python-hello-world-service jaeger
NOTE: The Python sample backend service makes use of the jaeger_client pip package. However, it's advisable to explore the OpenTelemetry Jaeger Exporter as preferred approach. Backend services for Go Gin, Rust Actix Web, and C# ASP .NET Core are not included in this example. Refer to the following links for guidance and instructions on getting started:
- OpenTelemetry-Go Jaeger Exporter
- opentelemetry-rust Github repo
- OpenTelemtry dotnet - Getting Started with Jaeger
To delete Docker resources that have been created, execute the following commands:
sudo docker rm -f $(sudo docker ps -qa)
sudo docker system prune --volumes --force