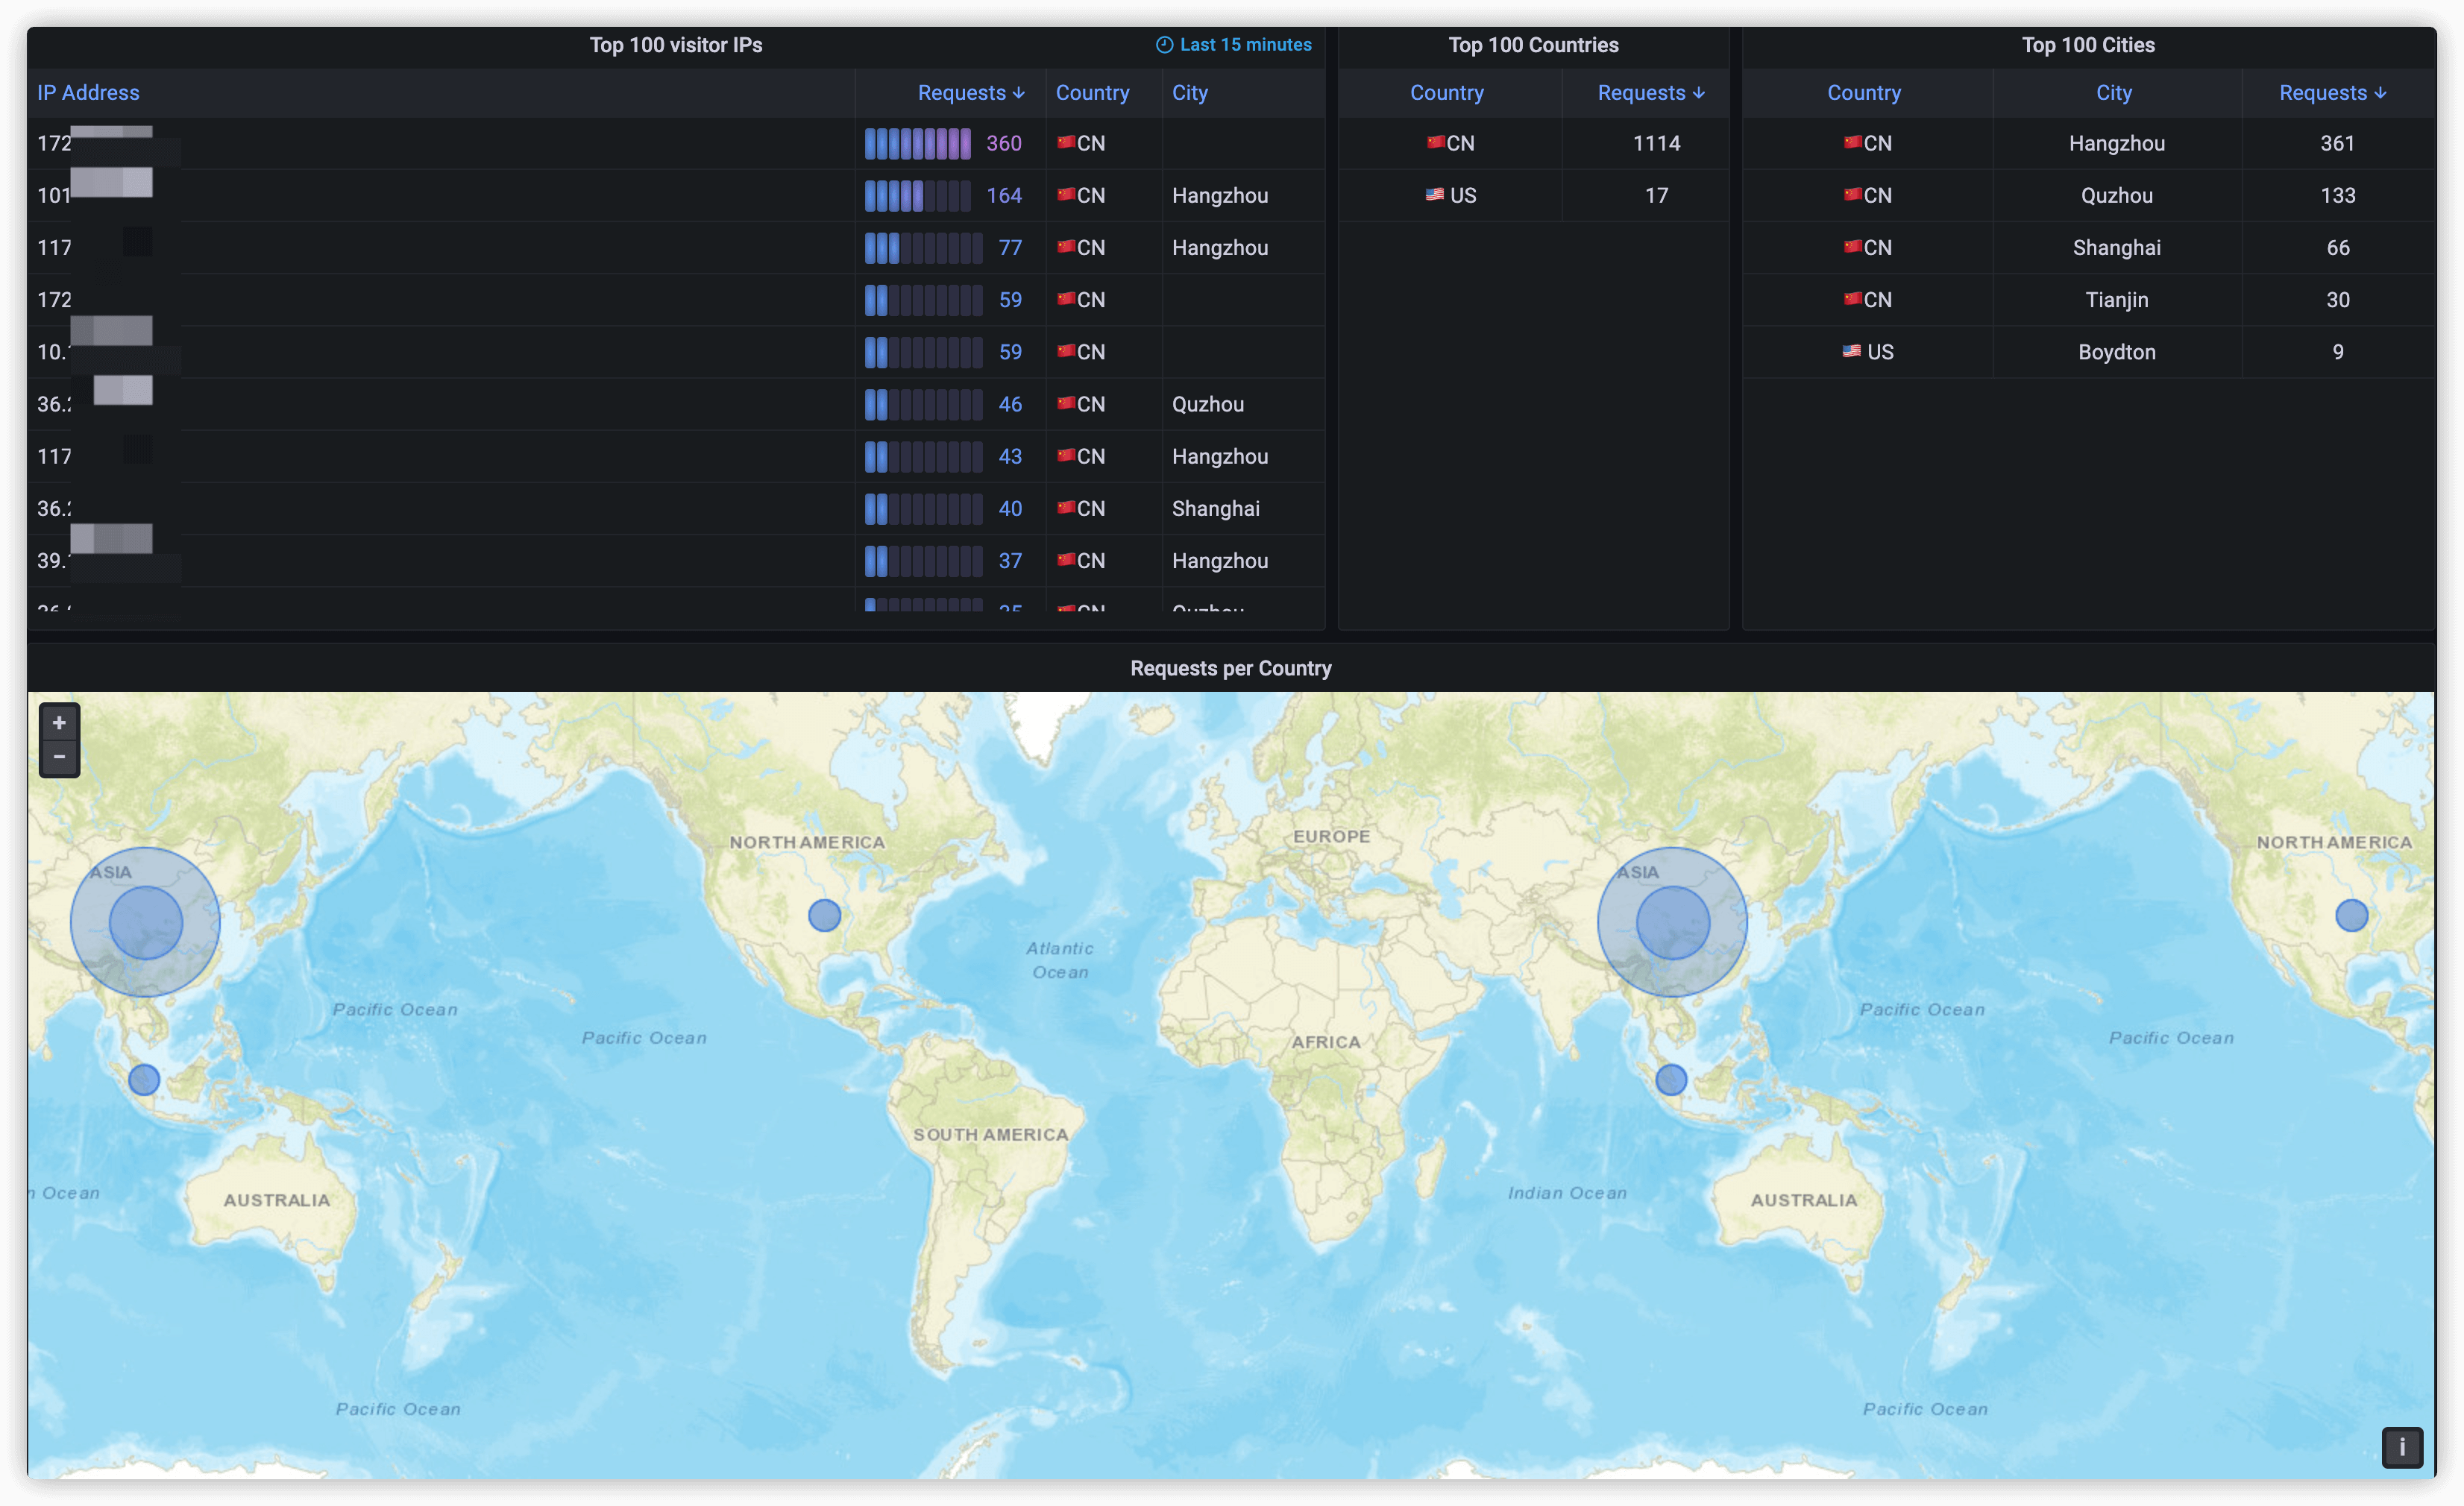
Enable Geoip2
If you want to count the requested geographic location information, you may need to enable the geoip or geoip2 module.
How to enable the geoip or geoip2 module will not be repeated here.
Before using geoip2, you may need to download the corresponding geographic location information database.
Maybe you can use MaxMind.
You can refer to the official documentation for related configuration.
You need to configure the output format of the Nginx log, here is a configuration for reference.
If you want to add more parameters, you can refer to the official documentation.
If you use docker to run Nginx, you can use docker's loki plugin to collect Nginx logs.
First you need to install docker loki plugins.
docker plugin install grafana/loki-docker-driver:latest --alias loki --grant-all-permissionsSecond, you can configure the log driver for the container in two ways.
- In the docker configuration file, for example, under linux it is
/etc/docker/daemon.jsonto add a configuration.- Such as:
"log-driver": "loki",
"log-opts": {
  "loki-url": "http://YOUR_IP:3100/loki/api/v1/push",
  "max-size": "50m",
  "max-file": "10"
}
- Next, you need to restart docker.
systemctl daemon-reload
systemctl restart docker
- It is worth noting that this configuration will only take effect for containers created after docker restart.
- Or you can specify log driver when the container starts.
- Corresponding to the above configuration is:
--log-driver=loki \
--log-opt loki-url="http://YOUR_IP:3100/loki/api/v1/push" \
--log-opt max-size=50m \
--log-opt max-file=10
Maybe you can use promtail to collect log files.
The following is the configuration for reference.
server:
  http_listen_port: 0
  grpc_listen_port: 0

positions:
  filename: /tmp/positions.yaml

clients:
  - url: https://USER:PASSWORD@logs-prod-us-central1.grafana.net/api/prom/push

scrape_configs:
    - job_name: system
      pipeline_stages:
      - replace:
          expression: '(?:[0-9]{1,3}\.){3}([0-9]{1,3})'
          replace: '***'
      static_configs:
      - targets:
         - localhost
        labels:
         job: nginx_access_log
         host: appfelstrudel
         agent: promtail
         __path__: /var/log/nginx/*access.log
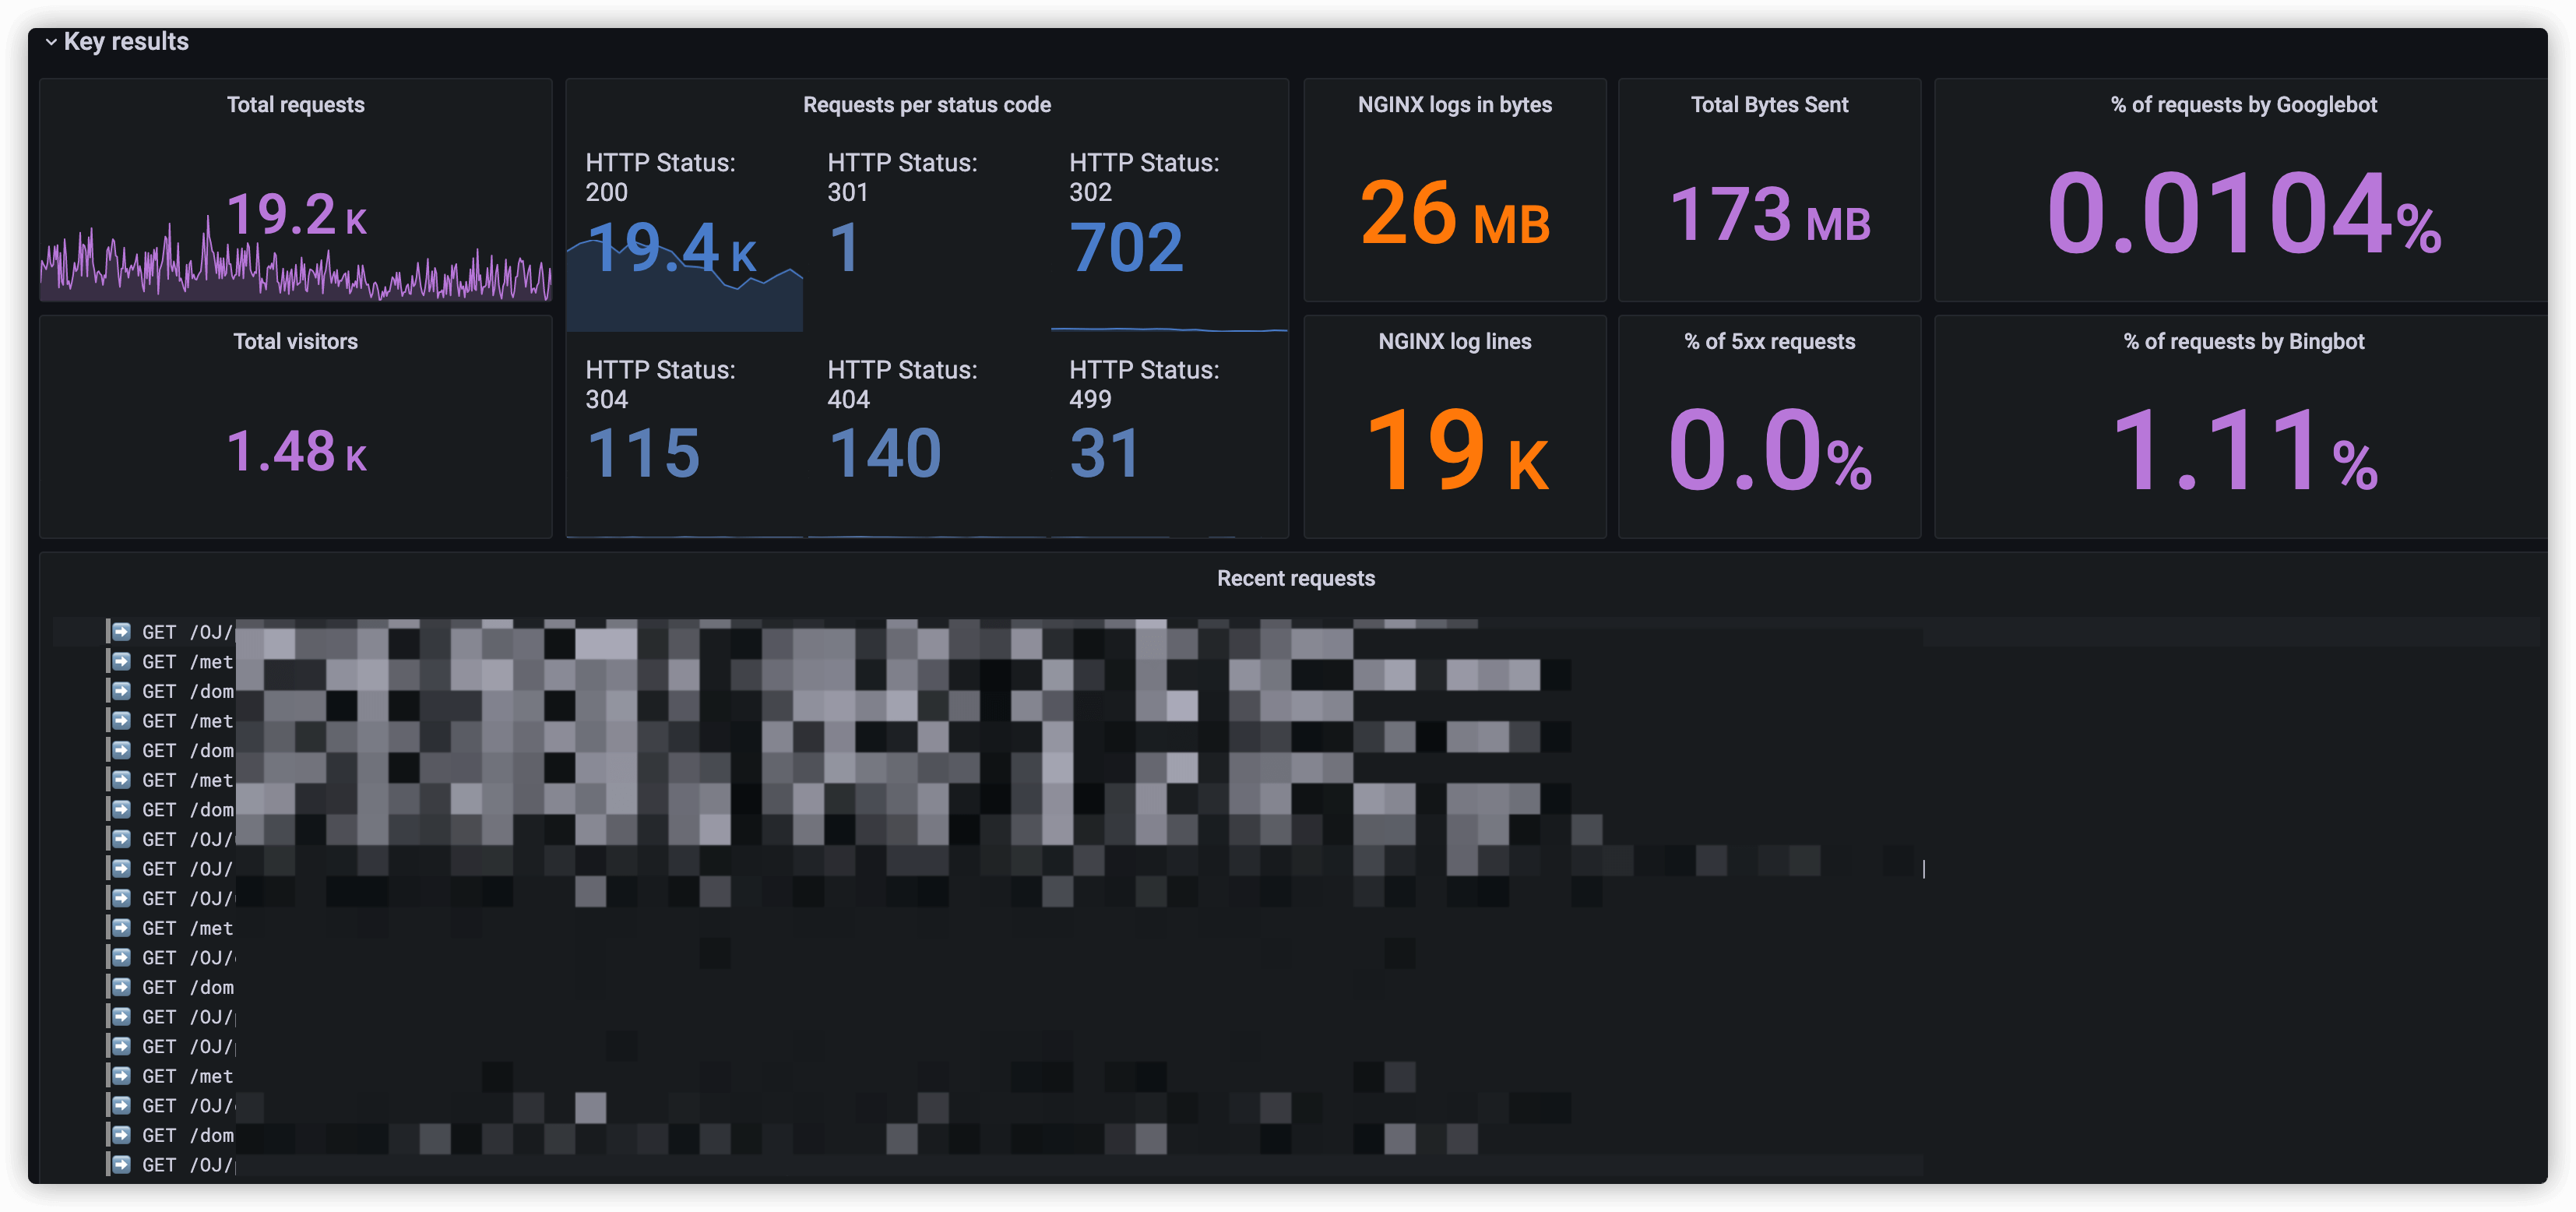
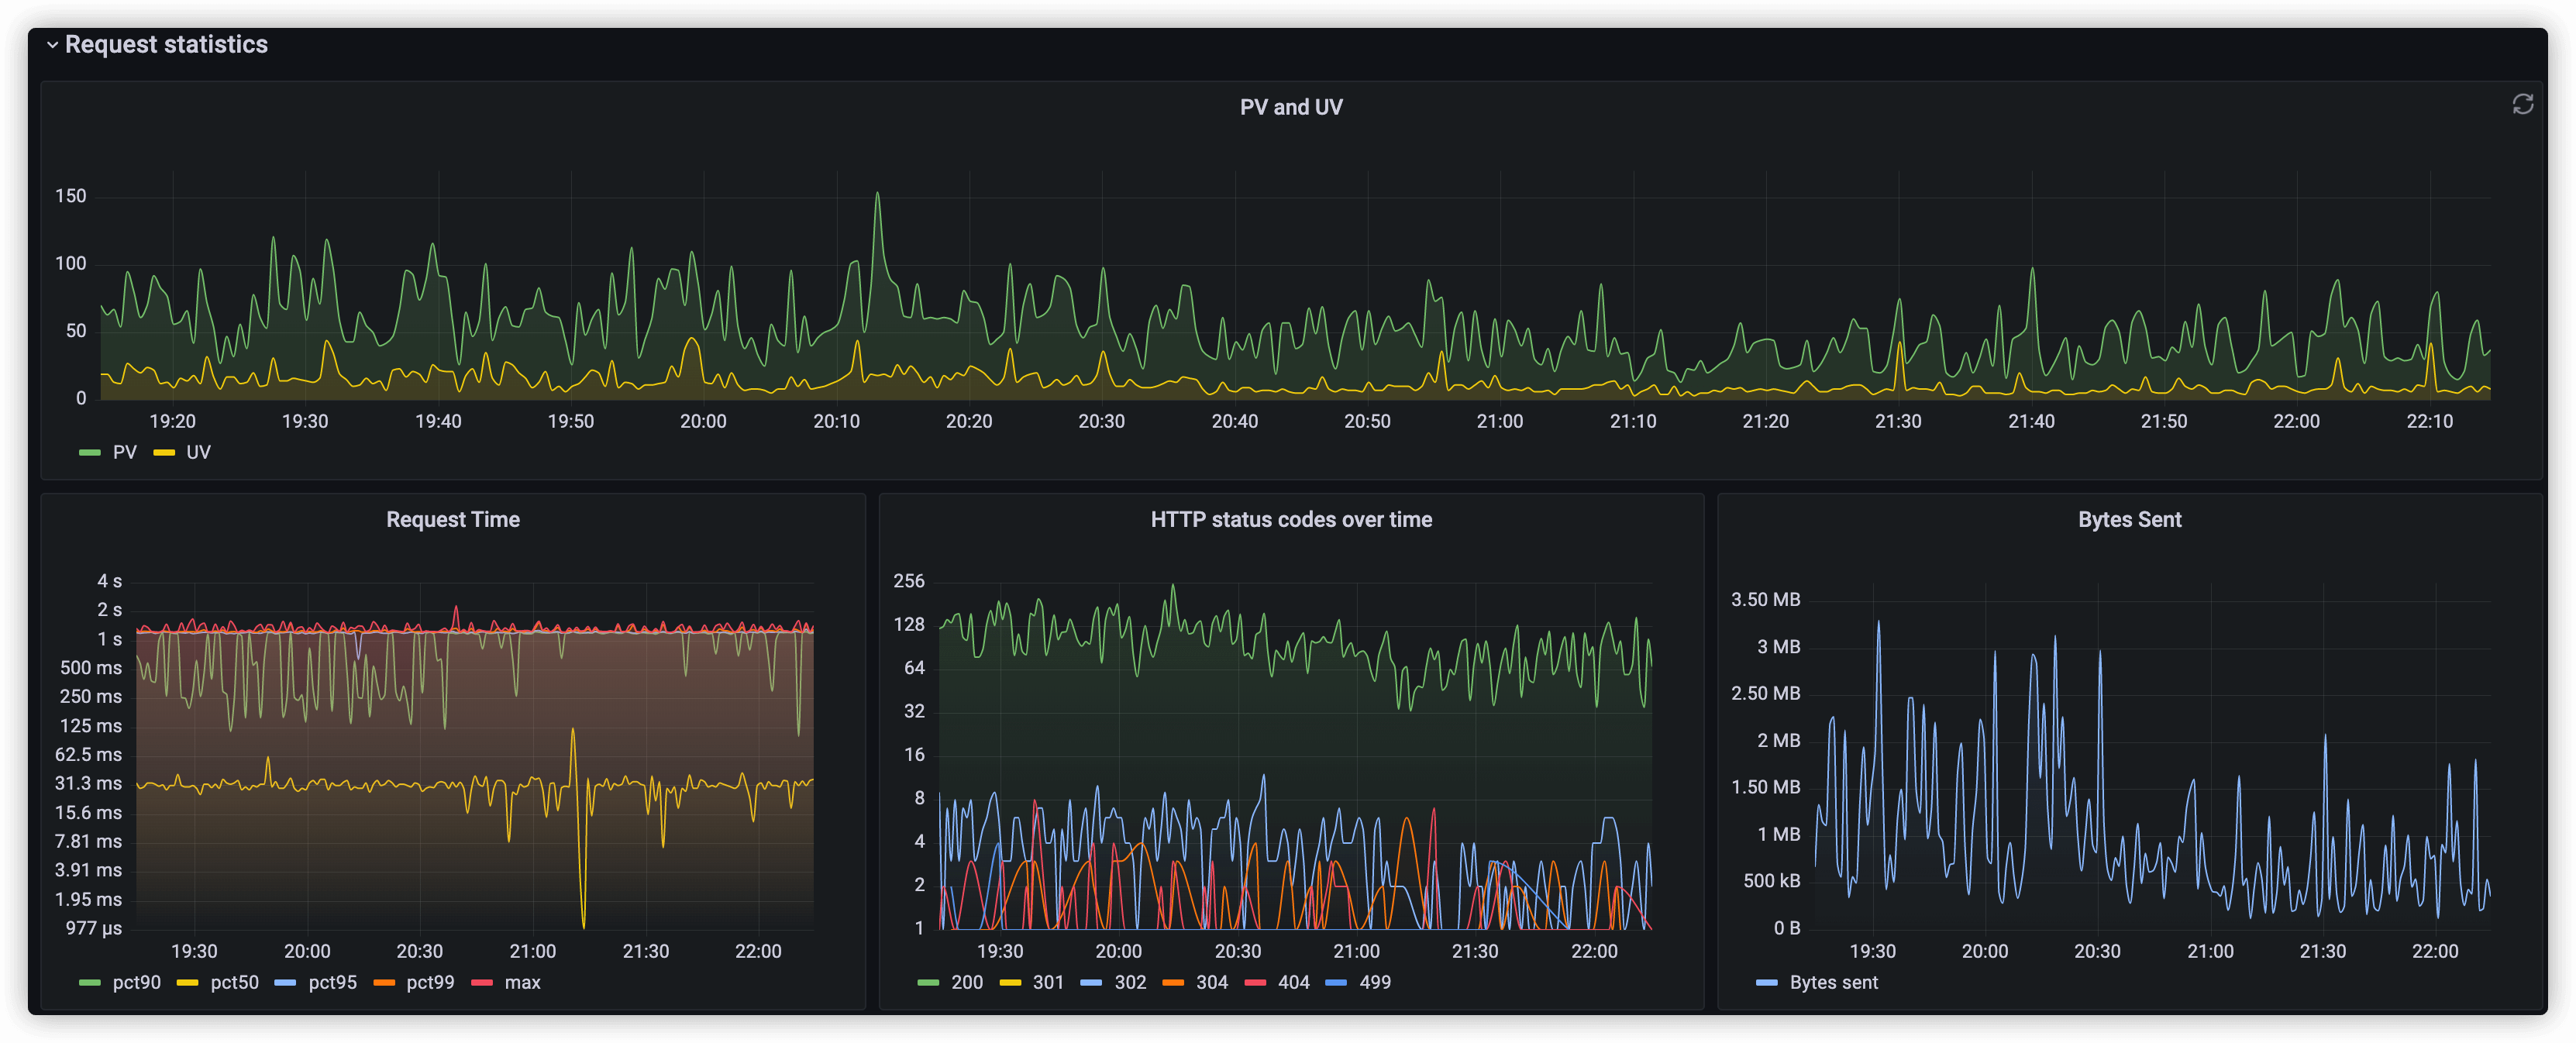
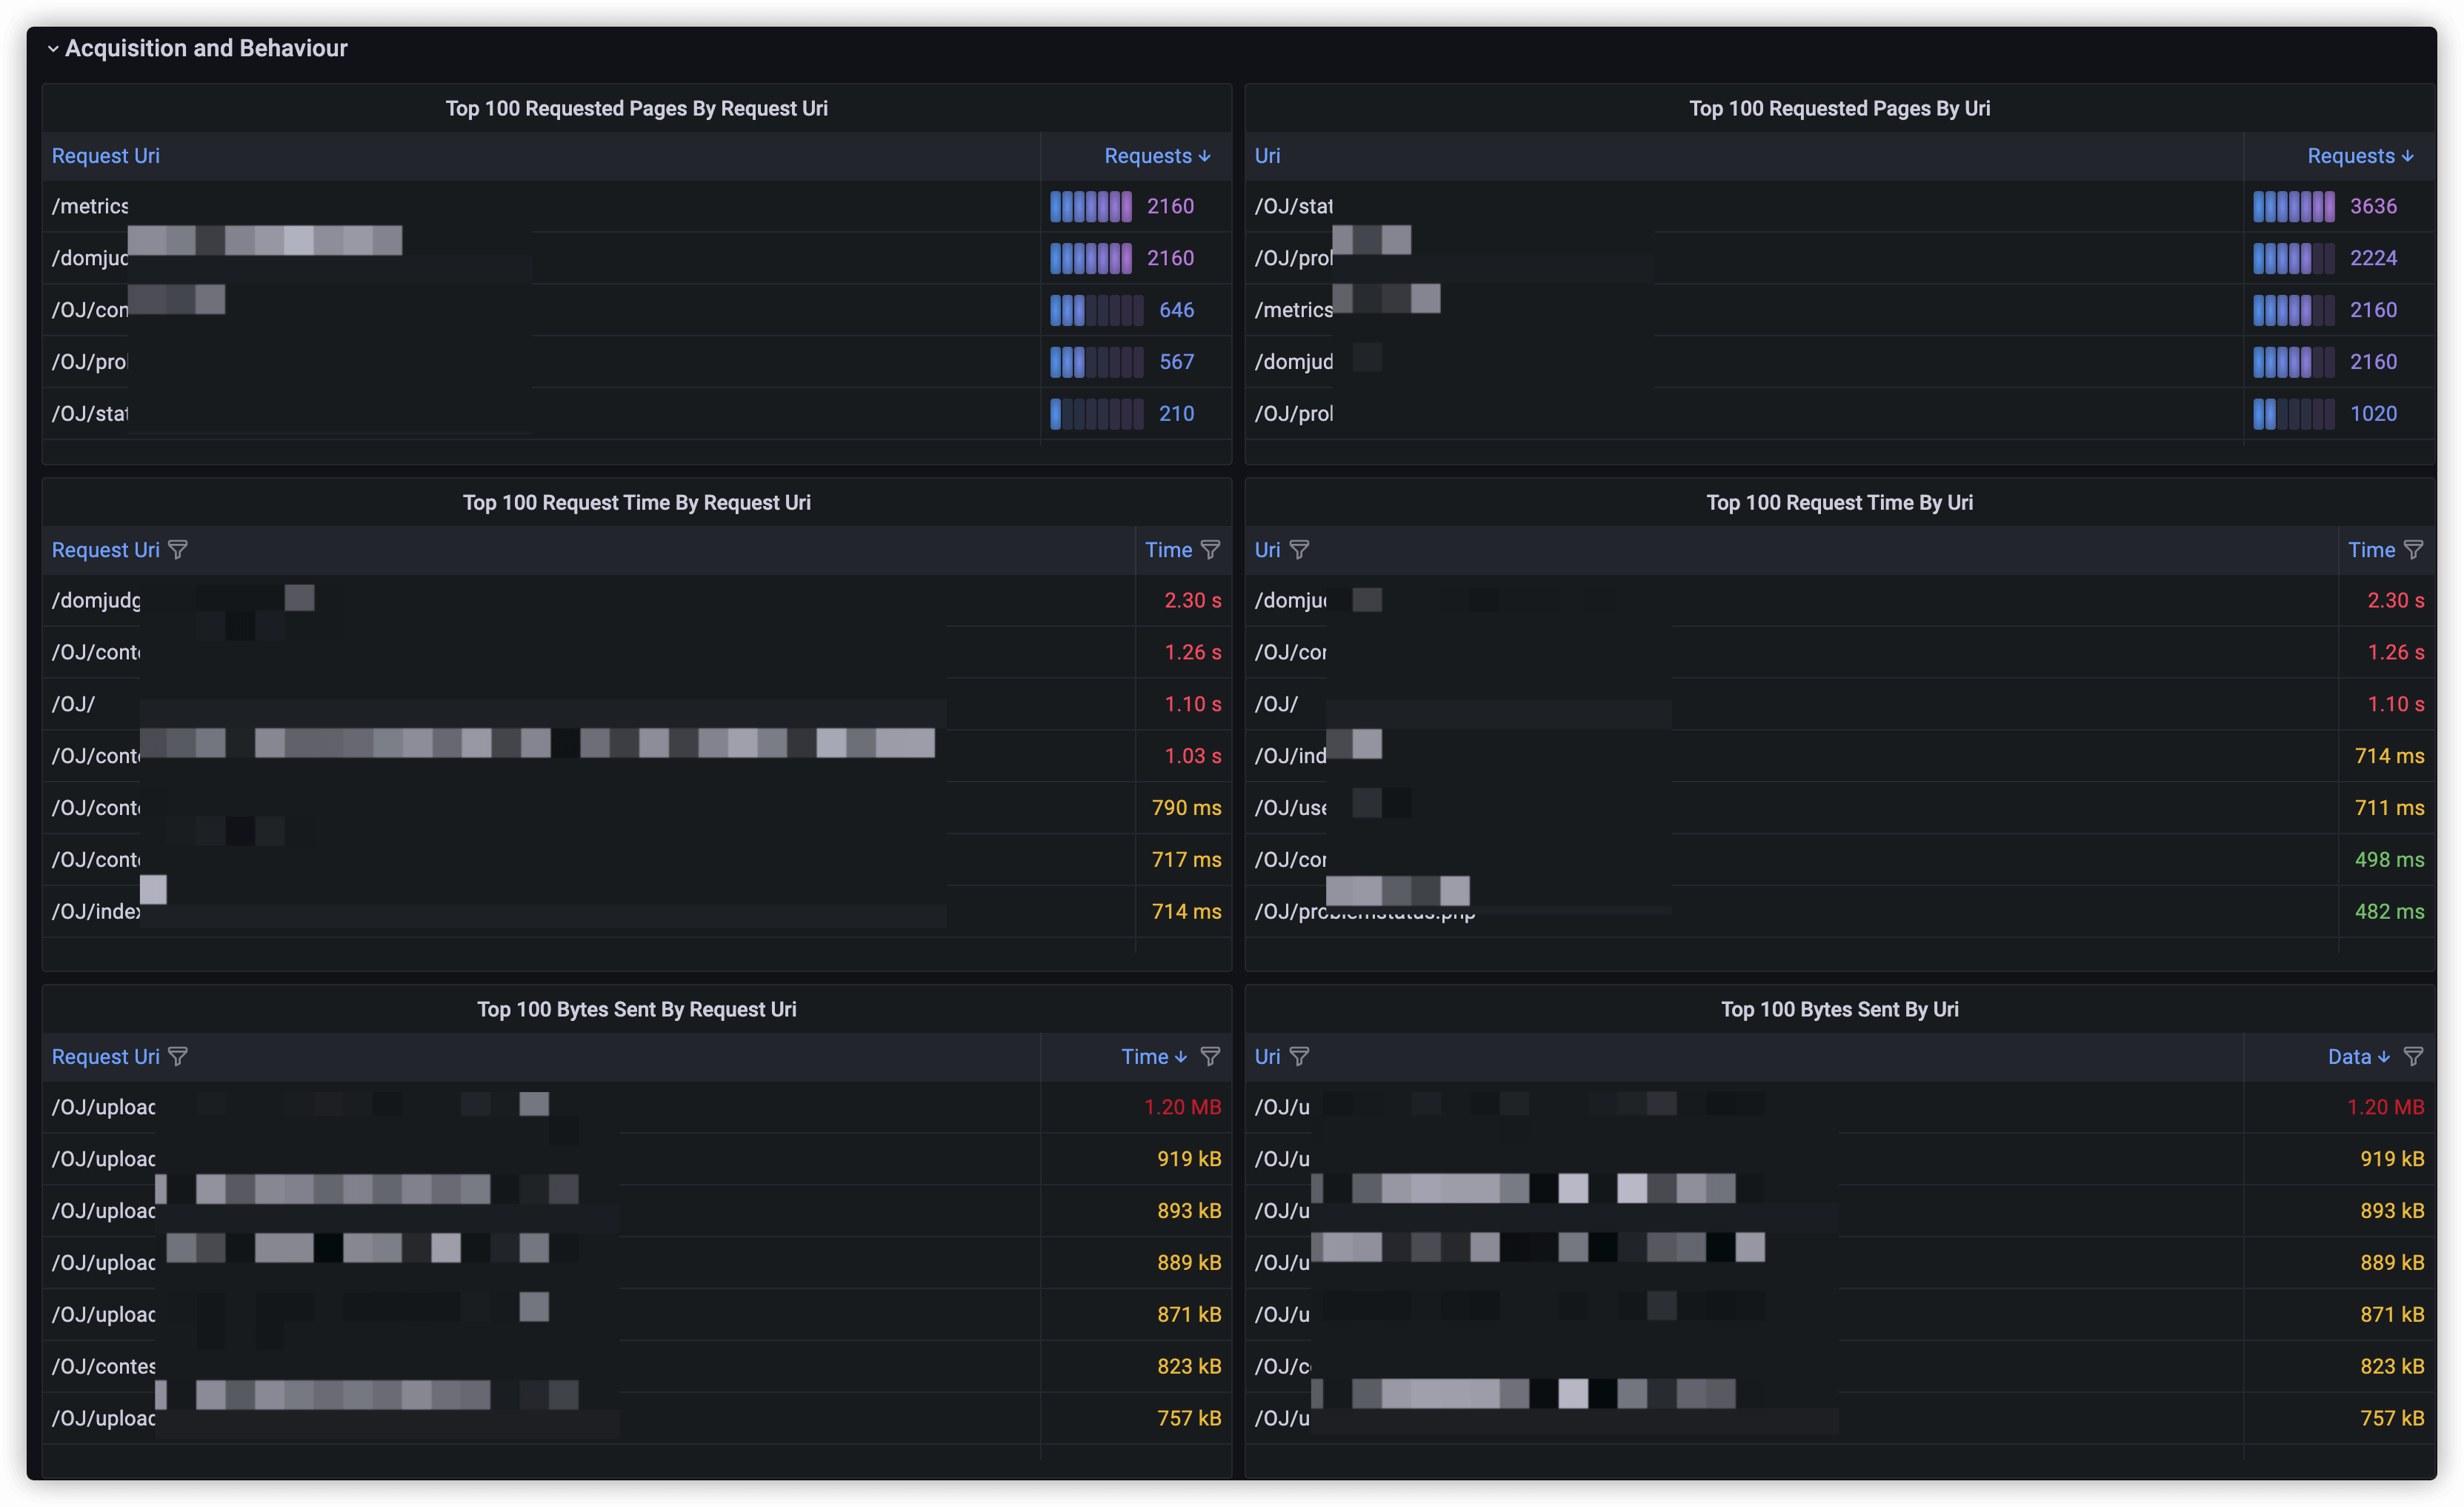
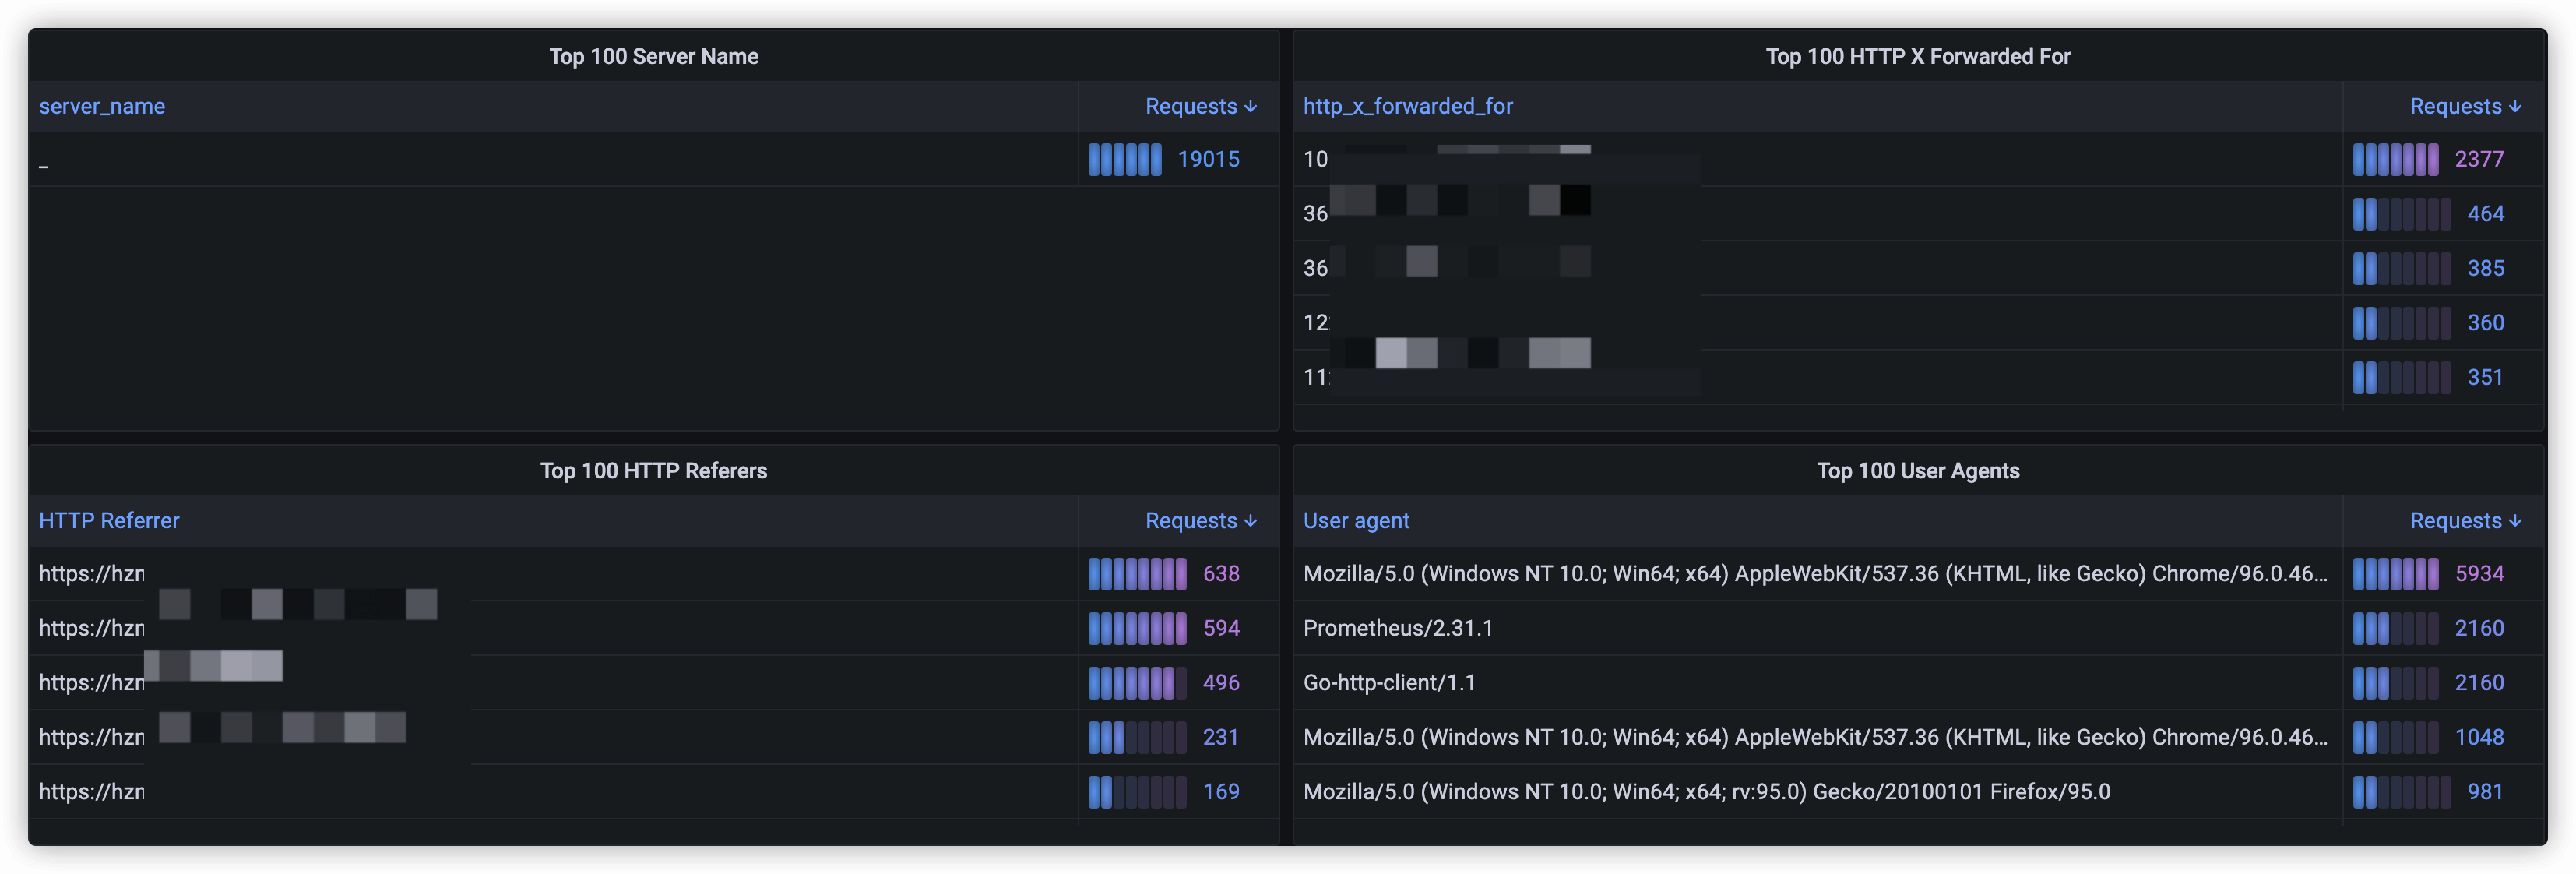
here is the Grafana Dashboard configuration file.
You can use regex to filter Server Name, Uri, Request Uri.
This is helpful when you use Nginx to handle the traffic of multiple websites.
