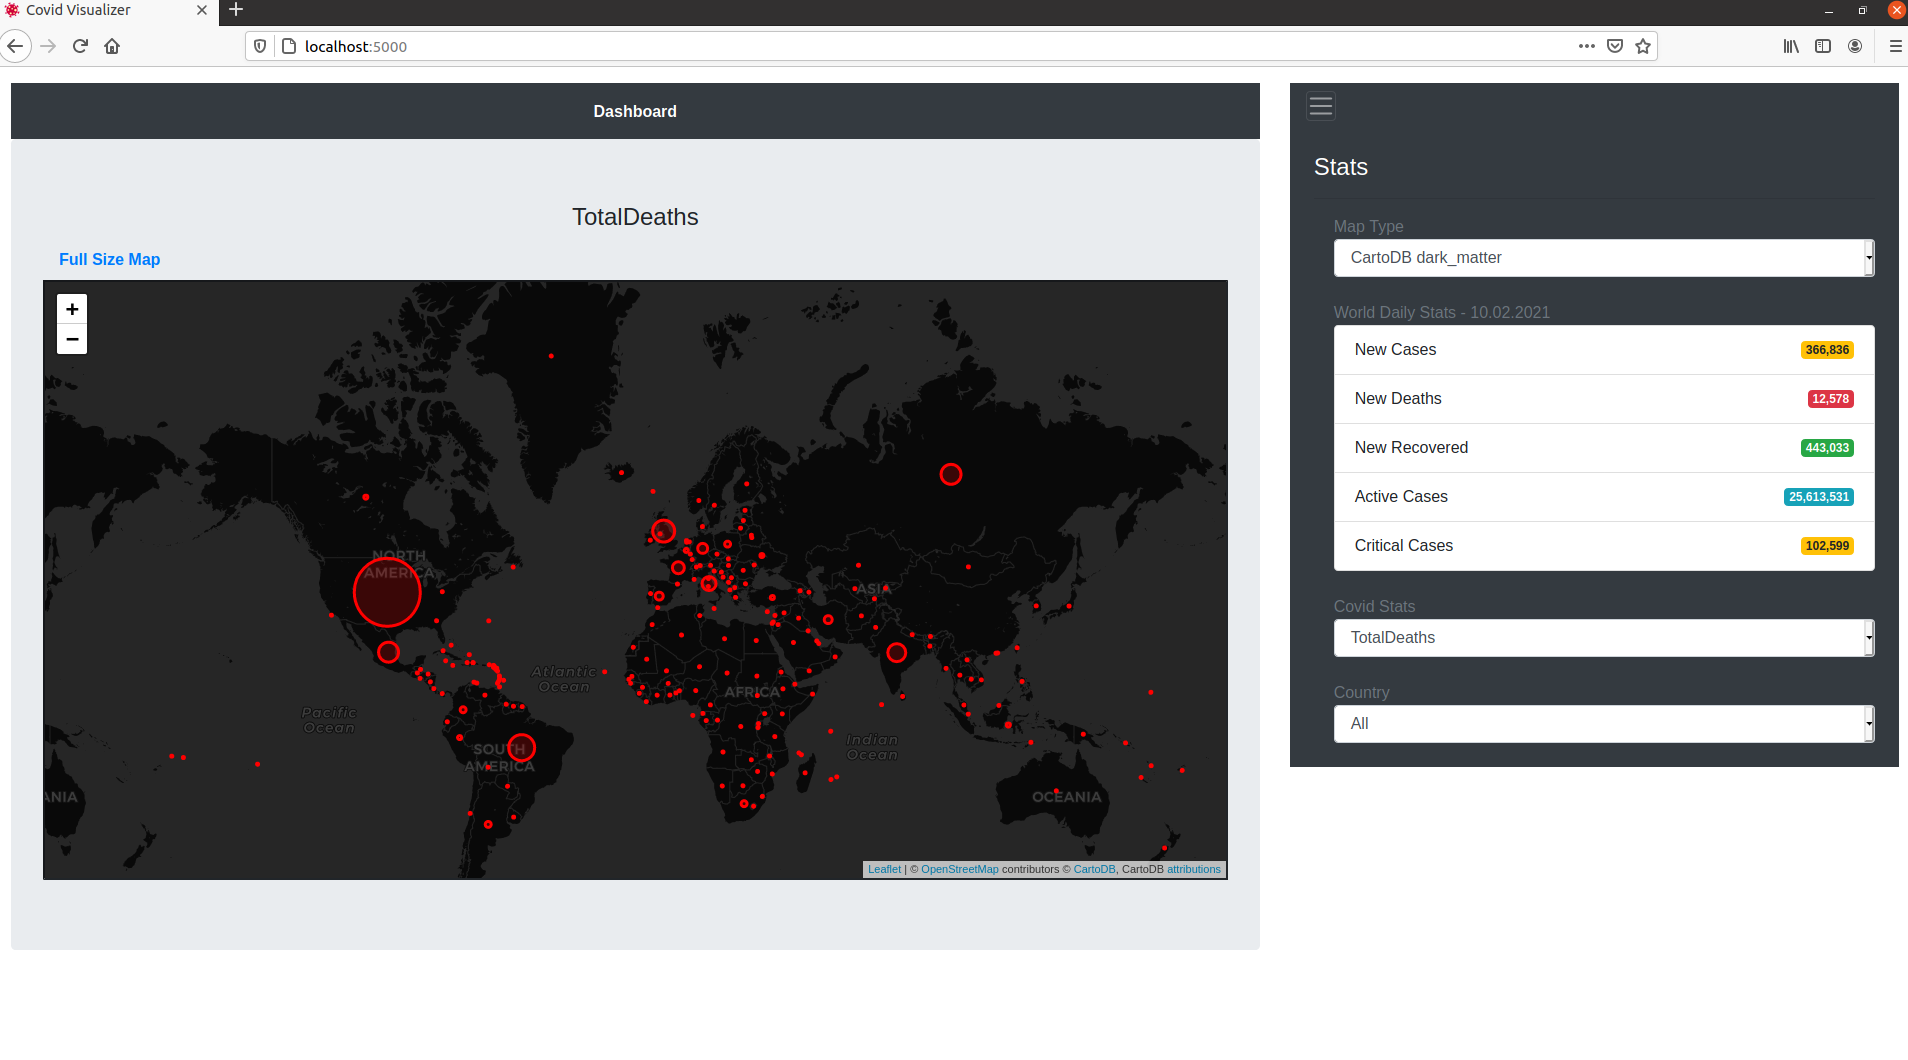
Here, I created a geographical map to visualize Covid-19 stats in the world using python flask framework and folium library.
Stats are retrieved from the https://www.worldometers.info/coronavirus/ website and can be updated everyday.
- covid-daily
- Flask
- folium
- geopy
- Jinja2
- numpy
- pandas
- python-dateutil
After installing the required packages, you can simply run the code as python wsgi.py and open the url localhost:5000 in your browser.
Here is the sample screenshot:
