Install from CRAN:
install.packages("topr")Or from github:
devtools::install_github("GenuityScience/topr")And then load the package:
library(topr)See the Input datasets vignette for more detailed information.
Input datasets must include least three columns (CHROM,
POS and P), where naming of the columns is flexible
(i.e the chr label can be either chr or chrom and is case insensitive).
topr has 3 in-built datasets (GWASes), take a look at one of them by issuing the following command:
head(CD_UKBB)The chromosome in the CHROM column can be represented with
our without the chr suffix, e.g (chr1 or 1)
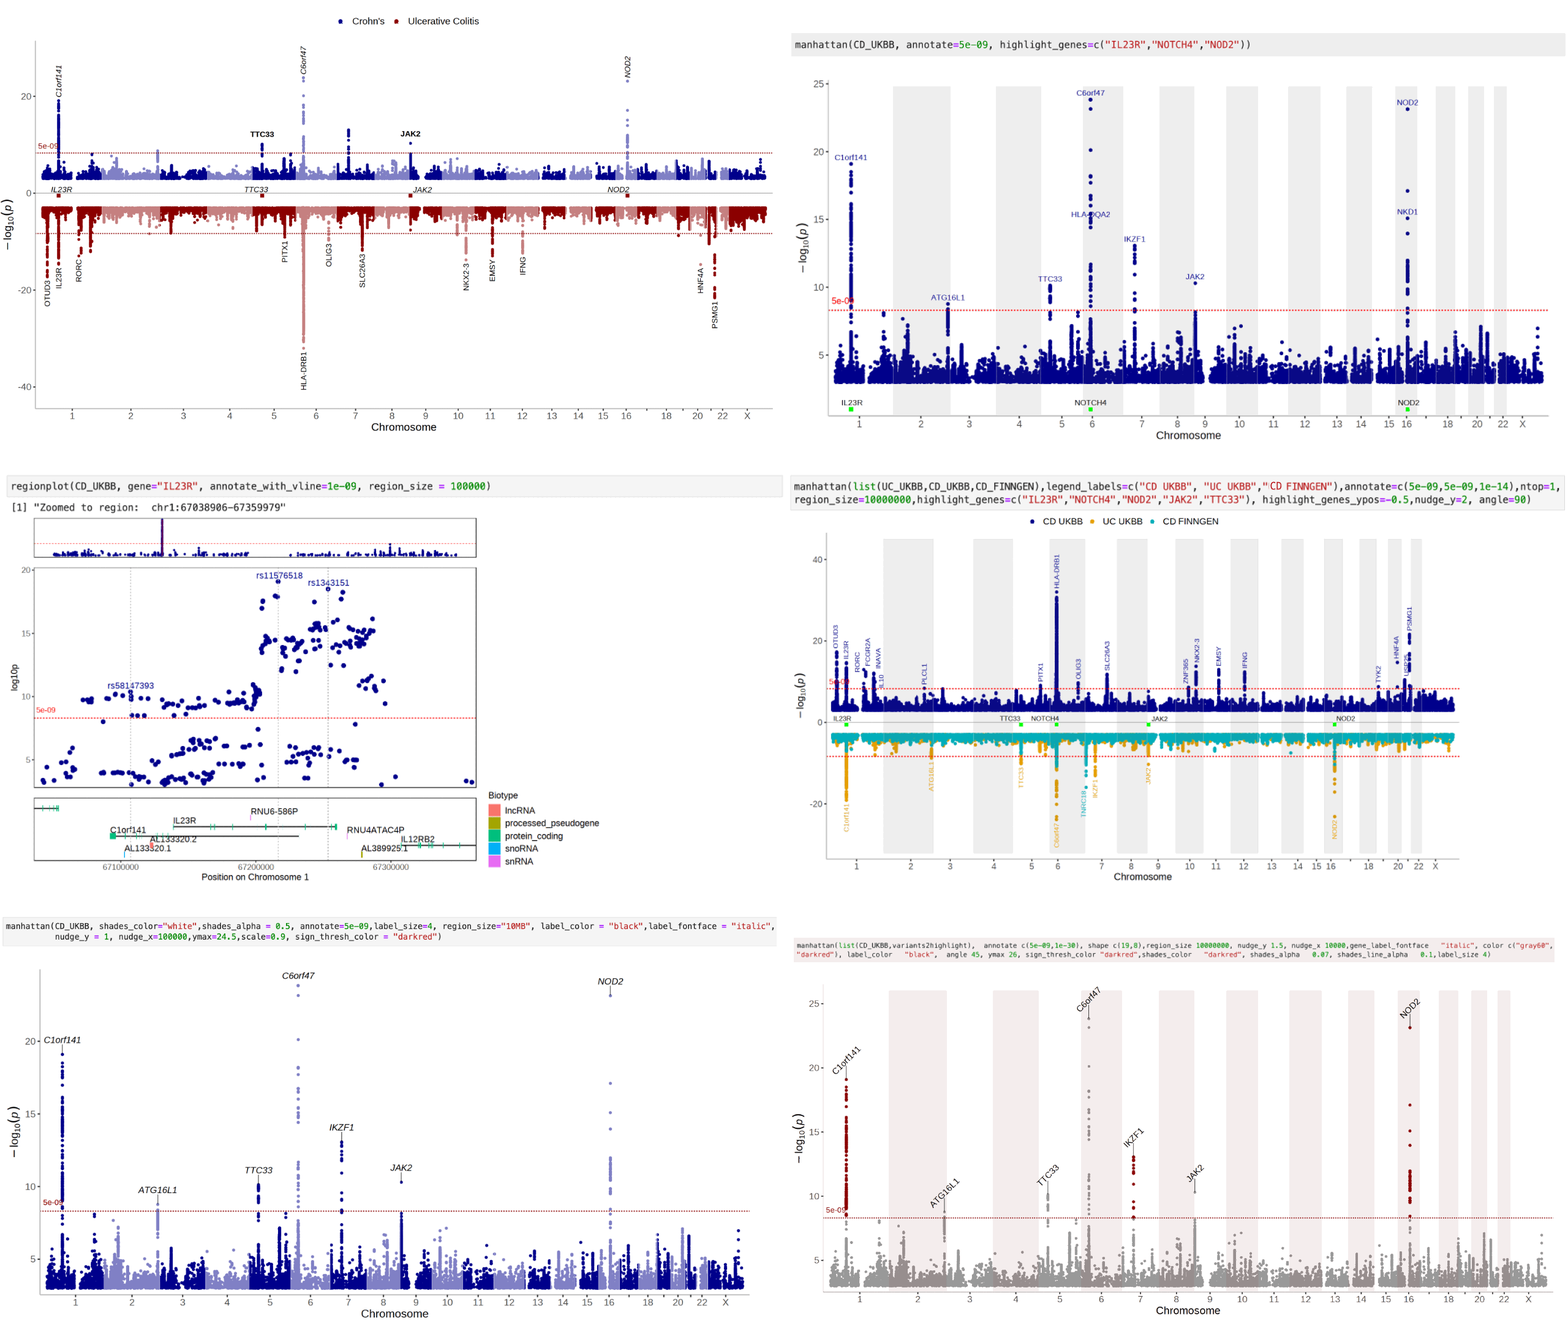
topr's two main plotting functions are manhattan() and regionplot()
See the Manhattan vignette for more detailed examples of how to use the manhattan plot function
View the whole genome association results on a Manhattan plot:
manhattan(CD_UKBB)Annotate the lead/index variants (with p-values below 5e-09) with their nearest gene:
manhattan(CD_UKBB, annotate=5e-09)See the Regionplot vignette for more detailed examples of how to use the regionplot function.
Further zoom-in on a genetic region by gene name:
regionplot(CD_UKBB, gene="IL23R")View the correlation pattern between the variants within the region in a locuszoom like plot. Note that the variant correlation (R2) has to be pre-calculated and included in the input dataframe.
locuszoom(R2_CD_UKBB, gene="IL23R")A region plot of multiple GWASes zoomed in on the IL23R gene
regionplot(list(UC_UKBB, CD_UKBB))Extract lead/index variants from the GWAS dataset (CD_UKBB):
get_lead_snps(CD_UKBB)
Annotate the lead/index variants with their nearest gene:
get_lead_snps(CD_UKBB) %>% annotate_with_nearest_gene()
Get genomic coordinates for a gene:
get_gene_coords("IL23R")
Get snps within a region:
get_snps_within_region(CD_UKBB, region = "chr1:67138906-67259979")
Get the top variant on a chromosome:
get_top_snp(CD_UKBB, chr="chr1")
?manhattan()
?regionplot()
?locuszoom()