This project was created for data scraping and data analysis of Python developer jobs on the site djinni.co. It builds graphs for detailed study and data analysis.
On Windows:
python -m venv venv
venv\Scripts\activate
On macOS:
python3 -m venv venv
source venv/bin/activatepip install -r requirements.txt👩 Set up config.py
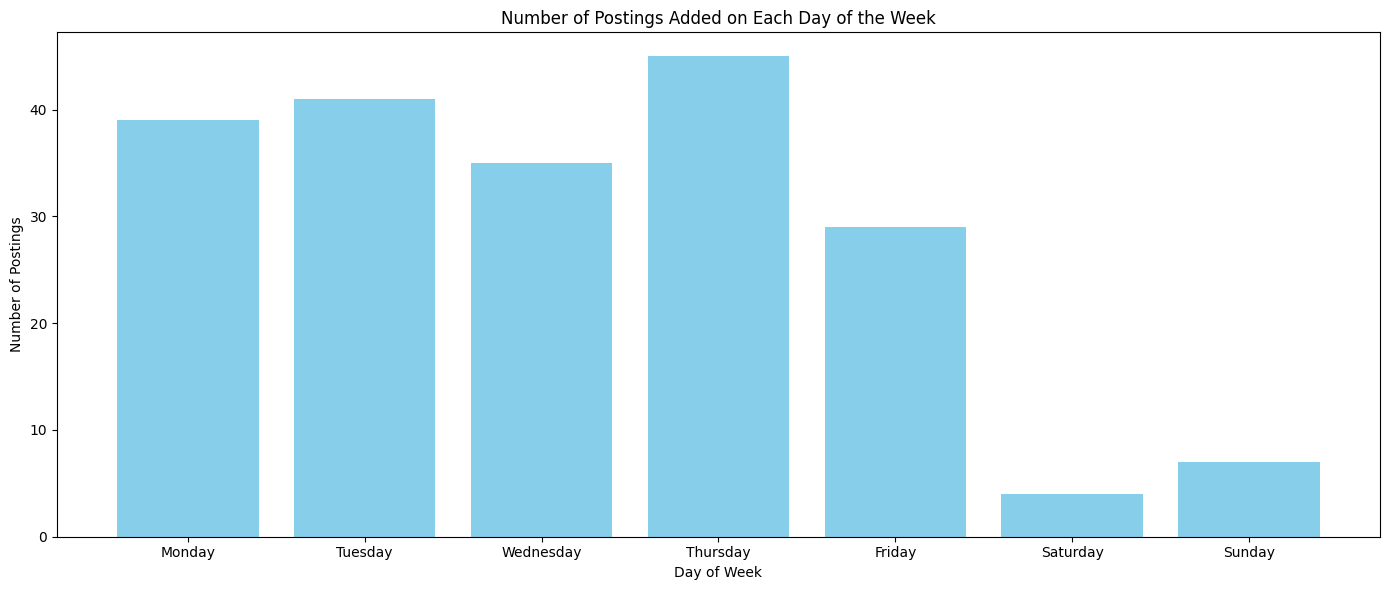
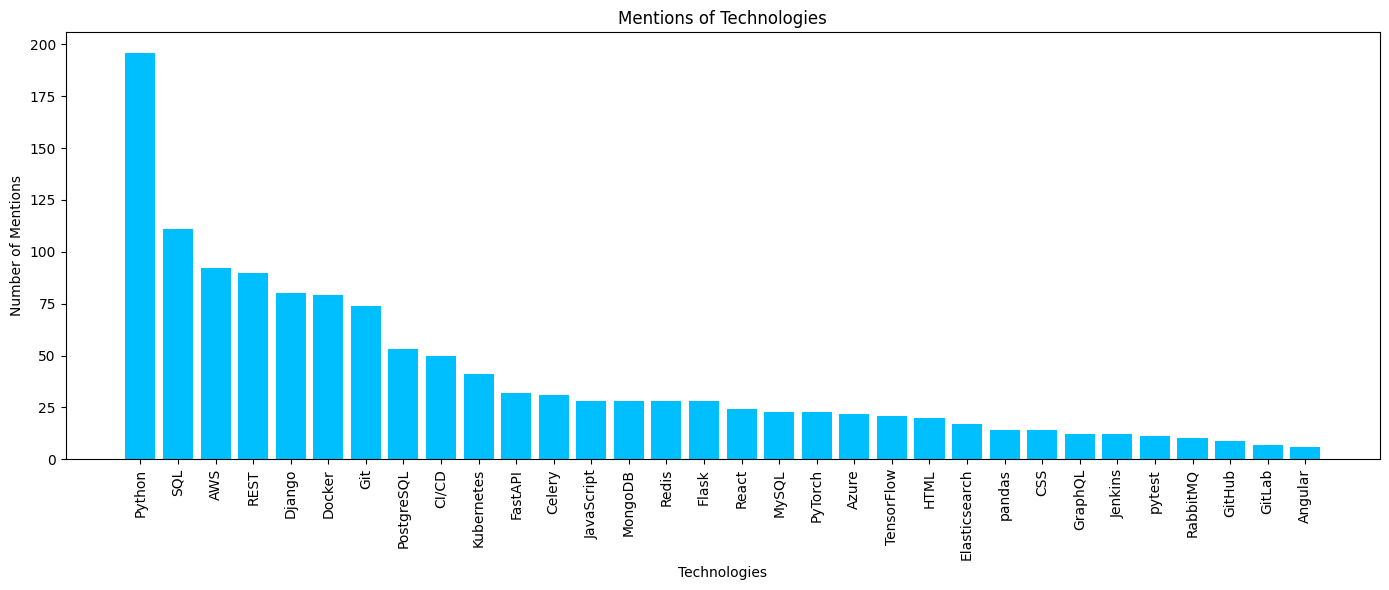
You can change that file to reorder days of week or change what technologies you want to count.
- You can run
python .\Scrapper\data_scrapper.pyto start process. - Now you will get a new .csv database in DataCollection folder.
- You can run
python .\Analysis\data_processor.pyto start process. It will check if database exists, if not will start scrapping. - In DataCollection folder you will get folder with current date, inside will be plots.
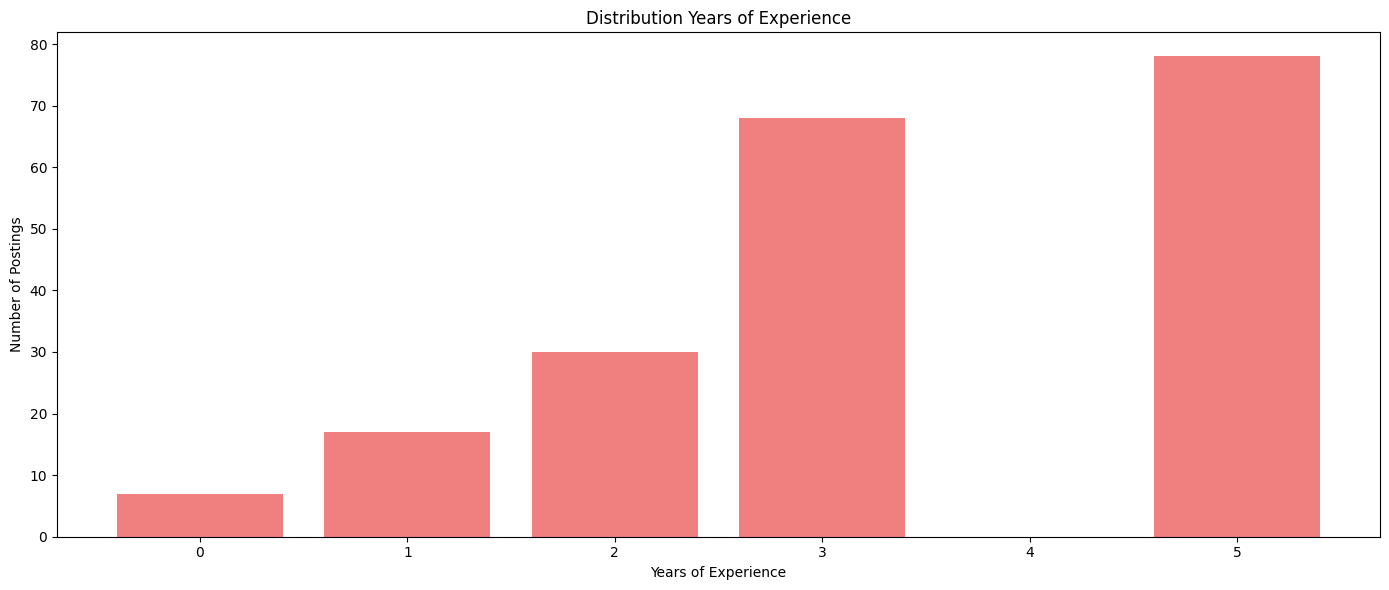
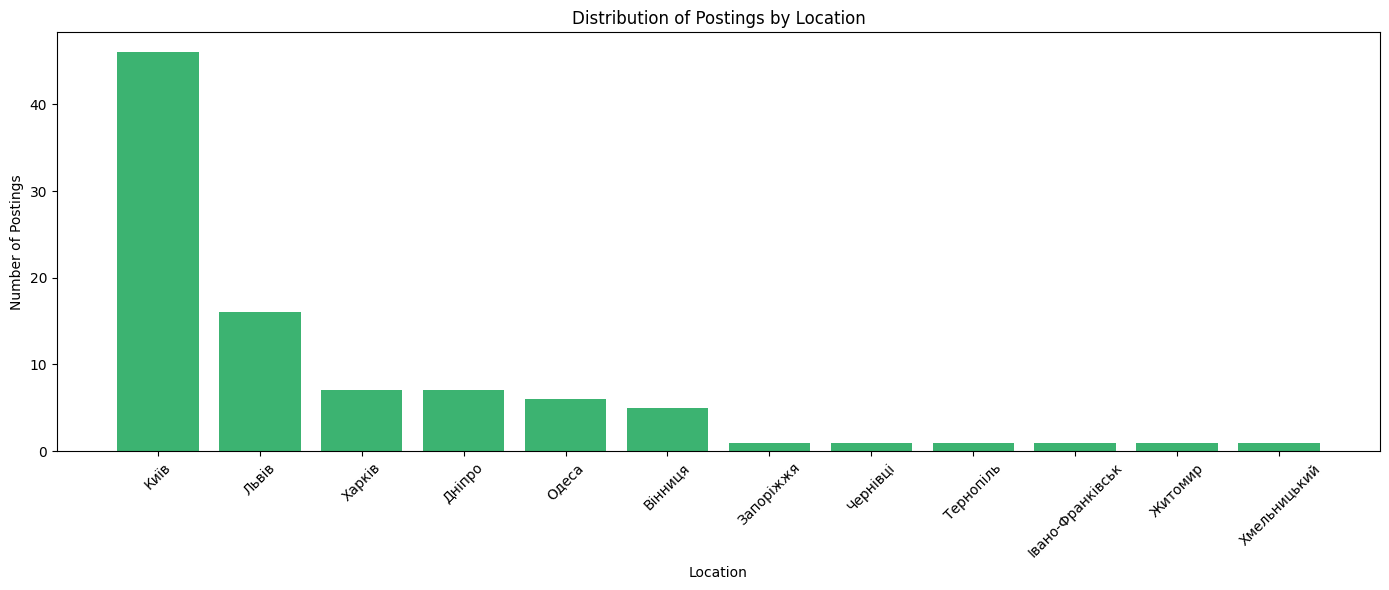
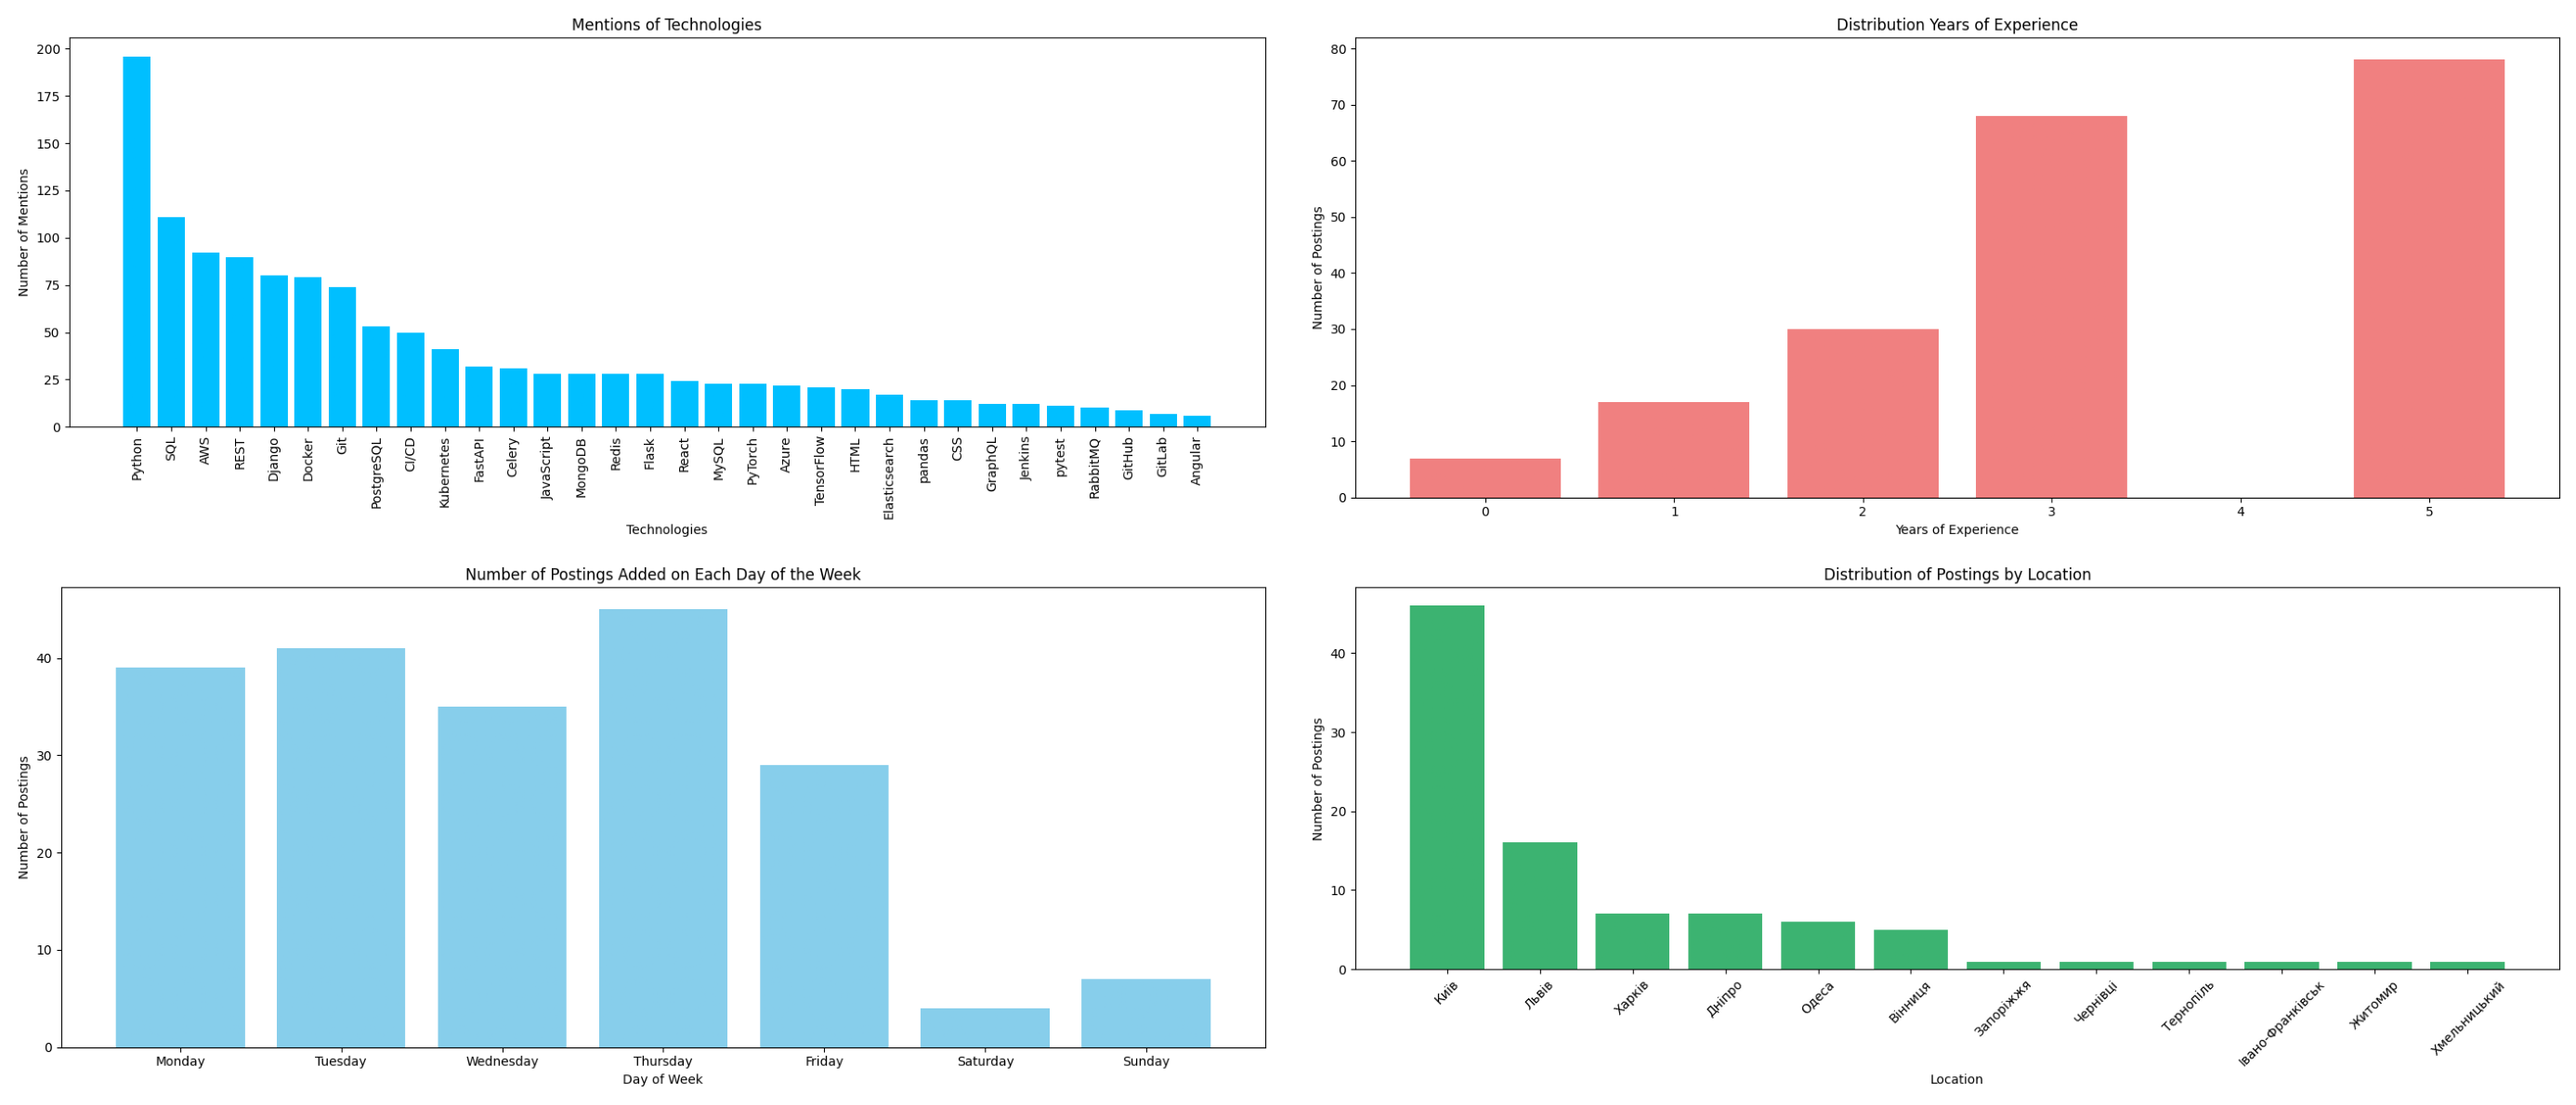
- All diagrams will be compiled to single one - combined_plot.png.
- And there will be separate diagrams.