This is a solution to the Expenses chart component challenge on Frontend Mentor. Frontend Mentor challenges help you improve your coding skills by building realistic projects.
Users should be able to:
- View the bar chart and hover over the individual bars to see the correct amounts for each day
- See the current day’s bar highlighted in a different colour to the other bars
- View the optimal layout for the content depending on their device’s screen size
- See hover states for all interactive elements on the page
- Bonus: Use the JSON data file provided to dynamically size the bars on the chart
-
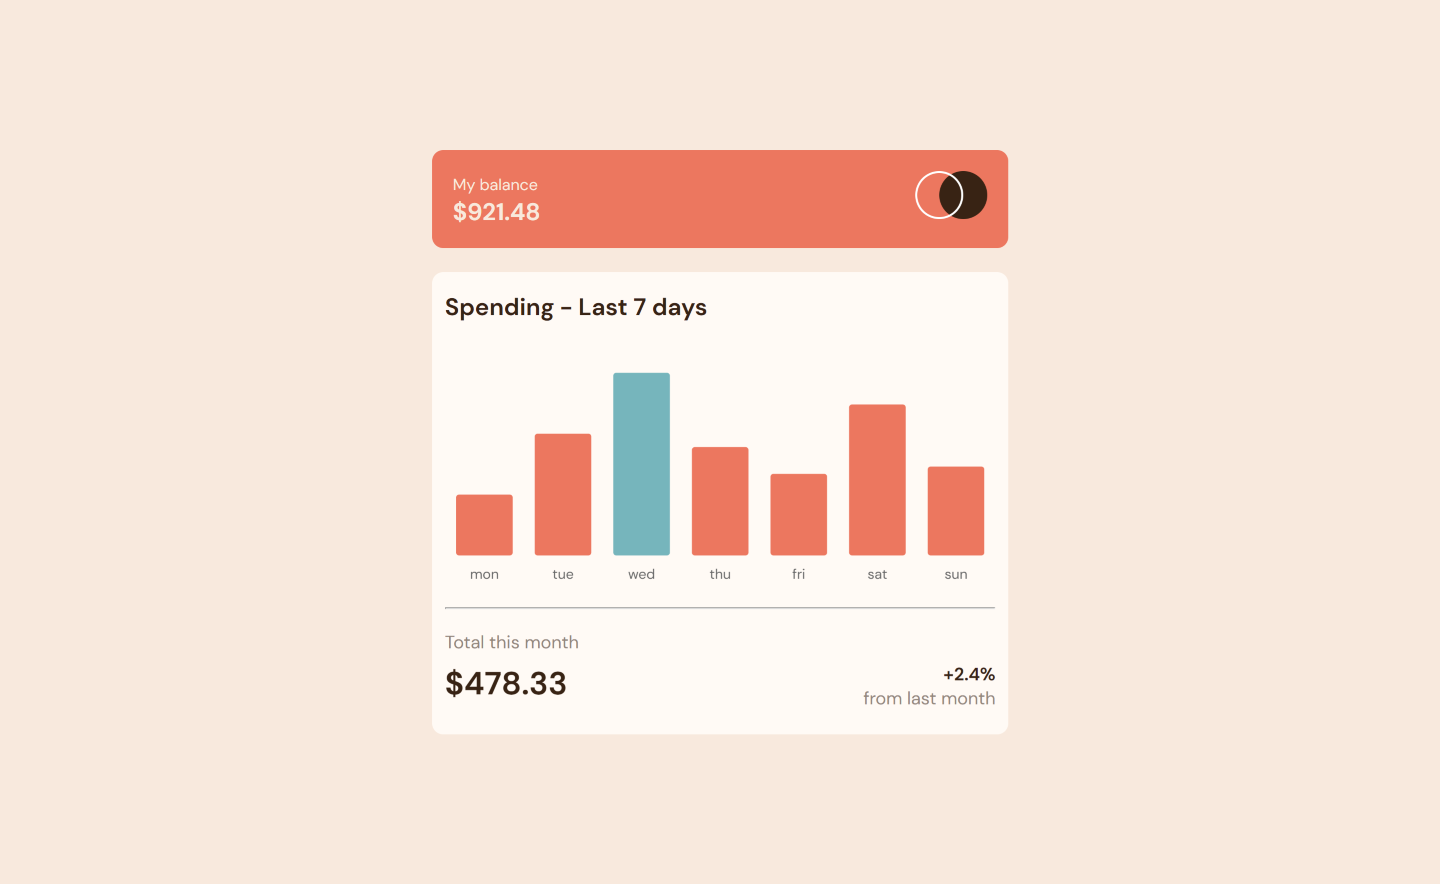
Desktop view
-
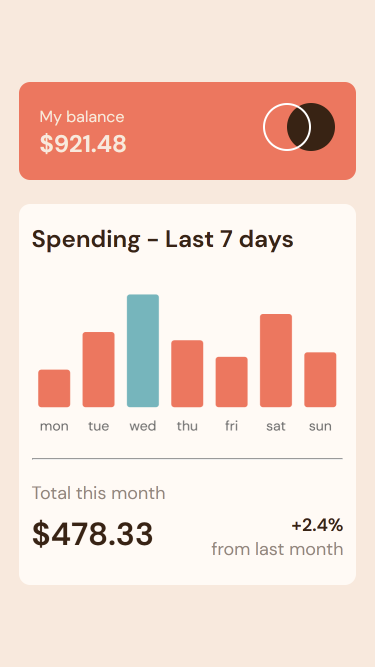
Mobile view


- Semantic HTML5 markup
- CSS custom properties
- Flexbox
- SCSS
- Mobile-first workflow
- Chart.js - JS library
- Integration of a JavaScript library using CDN.
<script src="https://cdn.jsdelivr.net/npm/chart.js@4.2.1/dist/chart.umd.min.js"></script>- Building and customization of bar chart with Chart.js
const myChart = new Chart(
    document.getElementById("myChart").getContext("2d"),
    config
);- Build a bar chart with Chart.js - Documentation for Chart.js library
- Frontend Mentor - @ChinatuL
- Twitter - @ChinatuLucia