Shellfish toxicity forecast serving package
remotes::install_github("BigelowLab/pspforecast")
-
version - the version/configuration of the model used to make the prediction
-
ensemble_n - number of ensemble members used to generate prediction
-
location - the sampling station the forecast is for
-
date - the date the forecast was made on
-
name - site name
-
lat - latitude
-
lon - longitude
-
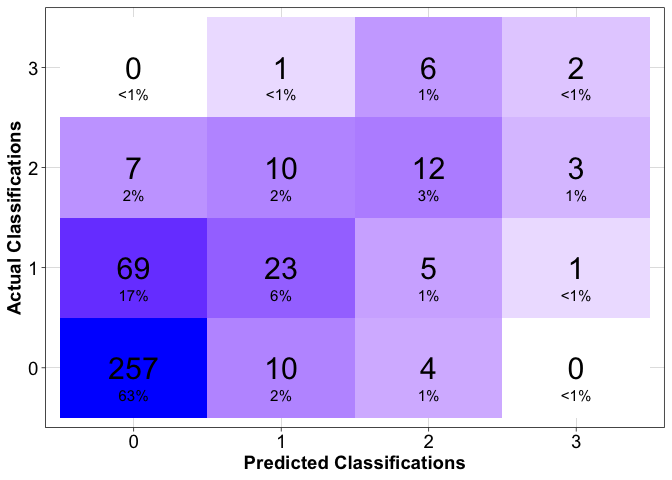
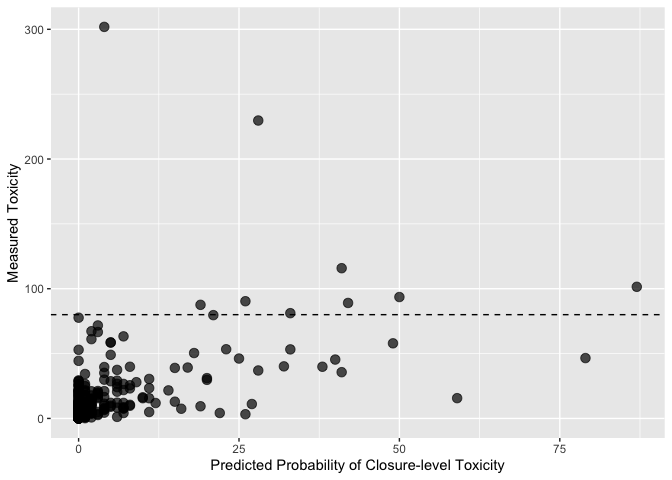
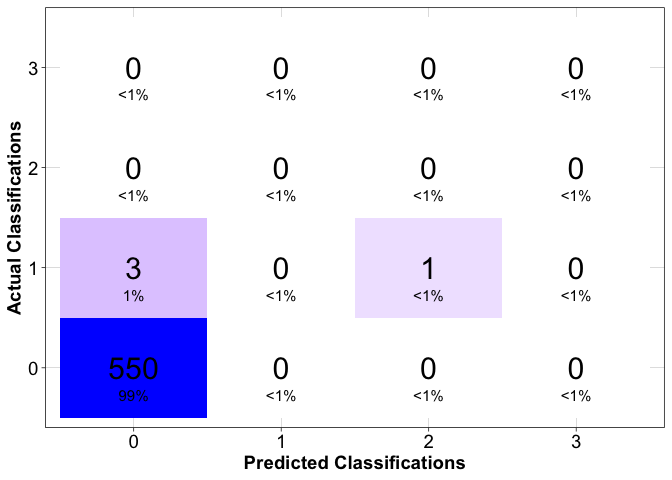
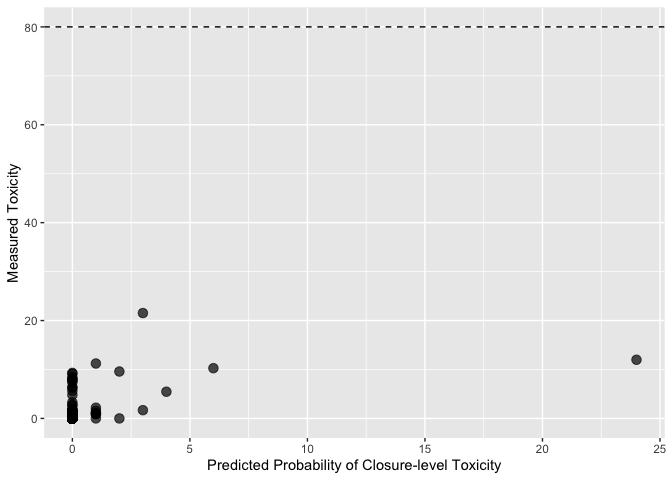
class_bins - the bins used to classify shellfish total toxicity (i.e. 0: 0-10, 1: 10-30, 2: 30-80, 3: >80)
-
forecast_date - the date the forecast is valid for (i.e. one week ahead of when it was made)
-
predicted_class - the predicted classification at the location listed on the forecast_date (in this case 0-3)
-
p_0 - class 0 probability
-
p_1 - class 1 probability
-
p_2 - class 2 probability
-
p_3 - class 3 probability
-
p3_sd - class 3 probability standard deviation
-
p_3_min - class 3 minimum probability (from ensemble run)
-
p_3_max - class 3 maximum probability (from ensemble run)
-
predicted_class - the predicted classification
predictions <- read_forecast(year = "2024") |>
  distinct()

glimpse(predictions)
## Rows: 90
## Columns: 19
## $ version <chr> "v0.3.0", "v0.3.0", "v0.3.0", "v0.3.0", "v0.3.0", …
## $ ensemble_n <dbl> 10, 10, 10, 10, 10, 10, 10, 10, 10, 10, 10, 10, 10…
## $ location <chr> "PSP10.11", "PSP10.33", "PSP12.01", "PSP12.03", "P…
## $ date <date> 2024-05-06, 2024-05-06, 2024-05-08, 2024-05-08, 2…
## $ name <chr> "Ogunquit River", "Spurwink River", "Basin Pt.", "…
## $ lat <dbl> 43.25030, 43.56632, 43.73848, 43.73064, 43.79553, …
## $ lon <dbl> -70.59540, -70.27305, -70.04343, -70.02556, -69.94…
## $ class_bins <chr> "0,10,30,80", "0,10,30,80", "0,10,30,80", "0,10,30…
## $ forecast_start_date <date> 2024-05-10, 2024-05-10, 2024-05-12, 2024-05-12, 2…
## $ forecast_end_date <date> 2024-05-16, 2024-05-16, 2024-05-18, 2024-05-18, 2…
## $ p_0 <dbl> 93, 100, 100, 99, 31, 3, 95, 94, 95, 95, 100, 99, …
## $ p_1 <dbl> 6, 0, 0, 1, 44, 13, 4, 5, 4, 5, 0, 1, 0, 42, 9, 40…
## $ p_2 <dbl> 1, 0, 0, 0, 18, 43, 0, 1, 0, 0, 0, 0, 0, 2, 0, 17,…
## $ p_3 <dbl> 0, 0, 0, 0, 7, 42, 0, 0, 0, 0, 0, 0, 0, 0, 0, 5, 3…
## $ p3_sd <dbl> 2.537746e-02, 1.702311e-04, 5.835063e-07, 3.170006…
## $ p_3_min <dbl> 2.803591e-02, 1.613240e-06, 4.298889e-09, 3.494154…
## $ p_3_max <dbl> 1.114067e-01, 5.424280e-04, 1.839769e-06, 9.452227…
## $ predicted_class <dbl> 0, 0, 0, 0, 1, 2, 0, 0, 0, 0, 0, 0, 0, 0, 0, 1, 1,…
## $ f_id <chr> "PSP10.11_2024-05-06", "PSP10.33_2024-05-06", "PSP…
## # A tibble: 1 × 1
##   accuracy
##      <dbl>
## 1    0.673
- tp - The model predicted class 3 and the following week’s measurement was class 3
- fp - The model predicted class 3 and the following week’s measurement was not class 3
- tn - The model predicted class 0,1,2 and the following week’s measurement was in class 0,1,2
- fn - The model predicted class 0,1,2 and the following week’s measurement was class 3
- precision - TP/(TP+FP)
- sensitivity - TP/(TP+FN)
- specificity - TN/(TN+FP)
## # A tibble: 1 × 7
##      tp    fp    tn    fn precision sensitivity specificity
##   <int> <int> <int> <int>     <dbl>       <dbl>       <dbl>
## 1     1     0    52     2         1       0.333           1
predictions <- read_forecast(year = "2023")## # A tibble: 1 × 1
## accuracy
## <dbl>
## 1 0.993
- tp - The model predicted class 3 and the following week’s measurement was class 3
- fp - The model predicted class 3 and the following week’s measurement was not class 3
- tn - The model predicted class 0,1,2 and the following week’s measurement was in class 0,1,2
- fn - The model predicted class 0,1,2 and the following week’s measurement was class 3
- precision - TP/(TP+FP)
- sensitivity - TP/(TP+FN)
- specificity - TN/(TN+FP)
## # A tibble: 1 × 7
##      tp    fp    tn    fn precision sensitivity specificity
##   <int> <int> <int> <int>     <dbl>       <dbl>       <dbl>
## 1     0     0   554     0       NaN         NaN           1
## # A tibble: 1 × 1
##   accuracy
##      <dbl>
## 1    0.799
- tp - The model predicted class 3 and the following week’s measurement was class 3
- fp - The model predicted class 3 and the following week’s measurement was not class 3
- tn - The model predicted class 0,1,2 and the following week’s measurement was in class 0,1,2
- fn - The model predicted class 0,1,2 and the following week’s measurement was class 3
- precision - TP/(TP+FP)
- sensitivity - TP/(TP+FN)
- specificity - TN/(TN+FP)
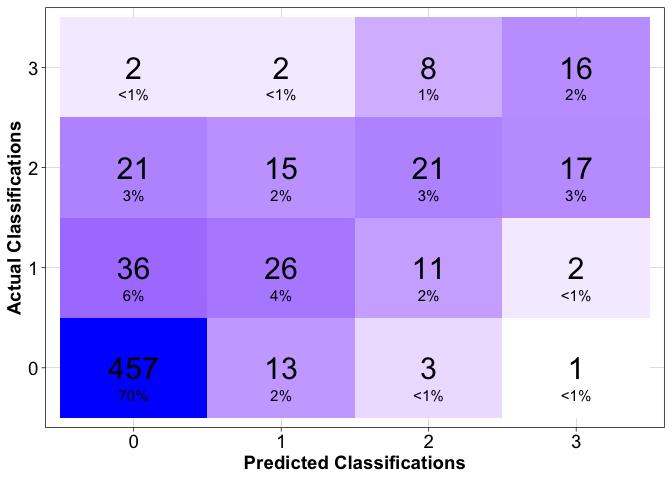
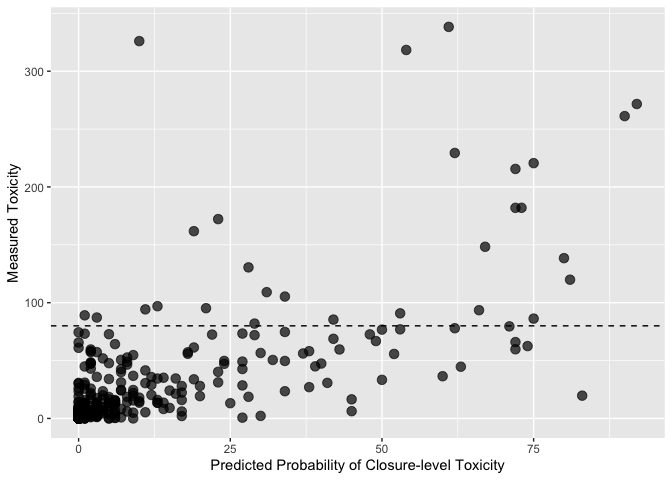
## # A tibble: 1 × 7
##      tp    fp    tn    fn precision sensitivity specificity
##   <int> <int> <int> <int>     <dbl>       <dbl>       <dbl>
## 1    16    20   603    12     0.444       0.571       0.968
## # A tibble: 1 × 1
##   accuracy
##      <dbl>
## 1    0.938
- tp - The model predicted class 3 and the following week’s measurement was class 3
- fp - The model predicted class 3 and the following week’s measurement was not class 3
- tn - The model predicted class 0,1,2 and the following week’s measurement was in class 0,1,2
- fn - The model predicted class 0,1,2 and the following week’s measurement was class 3
- precision - TP/(TP+FP)
- sensitivity - TP/(TP+FN)
- specificity - TN/(TN+FP)
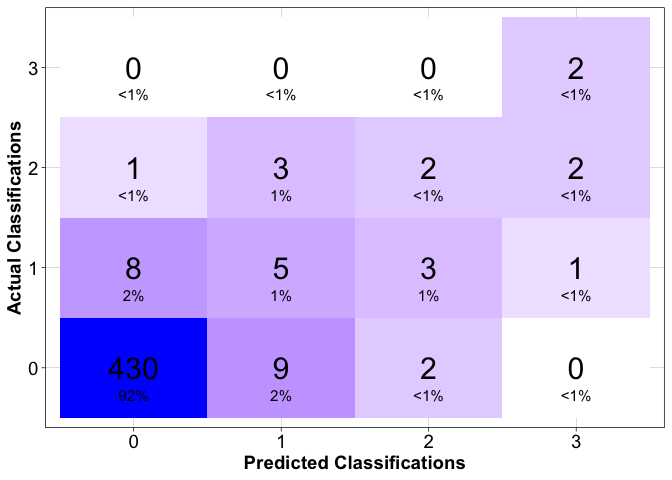
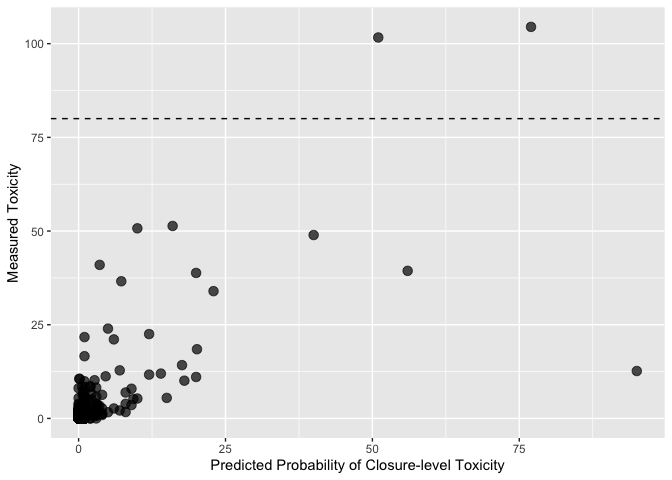
## # A tibble: 1 × 7
##      tp    fp    tn    fn precision sensitivity specificity
##   <int> <int> <int> <int>     <dbl>       <dbl>       <dbl>
## 1     2     3   463     0       0.4           1       0.994
## [1] "2024-05-31"
