Check dependencies for any files quick and easy.
Pick any file, and run View Dependencies from the command palette. The extension will generate a Dependency Report and open that in a web View.
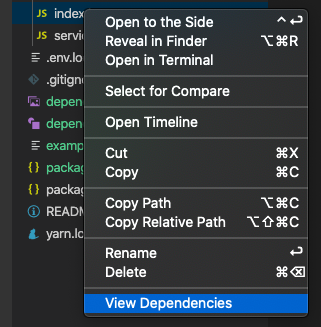
You Can also run the report from the content menu on any files:
Finally, you can click on each node, to open the file!
The extension supports configuration for generating the diagram:
- exclude: Define a regex to exclude dependencies for being listed. Defaults to
node_modules/ - maxDepth: Define the maximun depth the cruiser will go into dependencies.
- layout: Define the layout the diagram will use to display the tree. Defaults to
directed - prefix: Prefix to add to each node URL. For example, you can use this to alllow opening the file in github.
- moduleSystems: Define the module systems to be used. Supported:
['amd', 'cjs', 'es6', 'tsd']. Defaults to["amd", "cjs", "es6"] - tsConfig: Specify the path for the typescript configuration file. Defaults to
tsconfig.json - webpackConfig: Specify the path for the webpack configuration file. Defaults to
webpack.config.js - outputType: The output type will specify the tree be generated. Allowed options are
top,folderandnode. Defaults tonode
Use exclude to optimize the diagram you want to build.
- To include all the dependencies, just specify an empty string. WARNING: Consider adding
maxDepthin the case wherenode_modulesis not excluded to avoid vs code to freeze.
There are 7 layout options supported:
- directed: raws directed graphs (dot).
- undirected: draws undirected graphs using a ``spring'' model (neato).
- undirectedCompressed: draws undirected graphs (fdp).
- clustered: draws clustered graphs (osage).
- circular: draws distributed circular layout around connected nodes (circo).
- radial: draws graphs using a radial layout (twopi).
- treemap: draws the graph as a squarified treemap (patchwork).
- themes: Specify a theme for the graph.
For more detailed information check the graphviz manual. You can also check graphviz man pages.
- top will provide a high level dependencies overview
- folder is similar to archi but will report sublevel folders
- node is the default output reporter. It will generate a report based on leafs.
The webpackConfig configuration allows multiple options to be included. For example, you can specify environment variables and send arguments to webpack:
"options": {
  "webpackConfig": {
    "fileName": "webpack.config.js",
    "env": { "production": true },
    "arguments": { "mode": "production" }
  }
}
You can specify different types of themes.
basic: default theme UIsimple: bare bones UIblueprint: blueprint styleflat: flat UI stylecustom: Specify your own custom style. When specifying custom, you will also need to provide thecustomThemeconfiguration with it. Learn more about configurations on the Graphviz docs.
The extension needs at least Node.js 10.x to run.
node_modulesfolder is currently excluded by default so no dependencies on external libraries will be listed. It is planned for 1.0.0webpack configurationis not supported yet. It is planned for 1.0.0
Any other Known issue? We would really appreciate if you can open a issue.
- Generate a dependencies report from the command palette or from the context menu
- Open a dependency by clicking on the node from the report.


